ViewPoint Heuristic Evaluation
I designed and conducted a heuristic evaluation project for the Center for Academic Innovation's website, ViewPoint.
Project Timeline
Approximately 12 days (spread across the two days a week that I currently work part-time.)
Tools
- Google Sheets
- Sticky Notes
Skills
- Heuristic Evaluation
- Impact Matrix Prioritization
What is ViewPoint?
ViewPoint is a website designed for creating and running role-based simulations. Simulations allow students to take on perspectives that may differ from their own and to immerse themselves in scenarios.
A Quick Overview
ViewPoint is being used in more contexts, and as the platform continues to grow, the goal is for ViewPoint to provide the best possible user experience for all user types. This includes the people creating or modifying simulations, the ones facilitating the simulation process, and the participants interacting inside the simulation.
This usability report hopes to inform future design decisions and uncover any areas where there are opportunities to improve the usability.
I developed a series of research questions that I confirmed with my supervisors before moving into the specifics of planning the heuristic evaluation.
Research Questions
- General
- What are areas where VP is excelling in its usability?
- Where is there potential for small alterations that could improve usability?
- Are there any features of the site that would benefit from further examination/usability testing?
- Onboarding & Development of Experiences
- What is the onboarding experience like for all user types (simulation designer, facilitator, and participant)?
- What is the experience like around creating a new simulation?
- What is it like around copying a simulation and updating it?
- What is the experience like around each of the key features of the participant interface?
- Messages
- Surveys
- News feed use
- Profile customization
- Viewing the schedule
- Resources
- Groups & Roles on Dashboard vs. Groups & Roles page
- Notifications
The Process
This heuristic review involved walking through tasks and simulating users’ exploration of the interface. This exploration was completed for each of ViewPoint’s user types: participants, facilitators, and simulation designers.
Along with evaluating the interface myself, I also asked 2 other fellows to complete evaluations. We obtained copies of 2 simulations that have been used in classroom settings: “Line 5 Demo Sim” and “Broadening Access to Public Higher Education”, and we created facilitator and participant accounts.
While completing tasks, we evaluated our observations based on Nielsen’s 10 Heuristics. In evaluating the interface, we rated each issue/observation on a scale from 0-4:
- 0: I don't agree that this is a usability problem at all
- 1: Cosmetic problem only: need not be fixed unless extra time is available
- 2: Minor usability problem: fixing this should be given low priority
- 3: Major usability problem: important to fix, so should be given high priority
- 4: Usability catastrophe: imperative to fix this
After we each evaluated the interface individually, we met and discussed our findings, which lead to the recommendations listed under Findings.
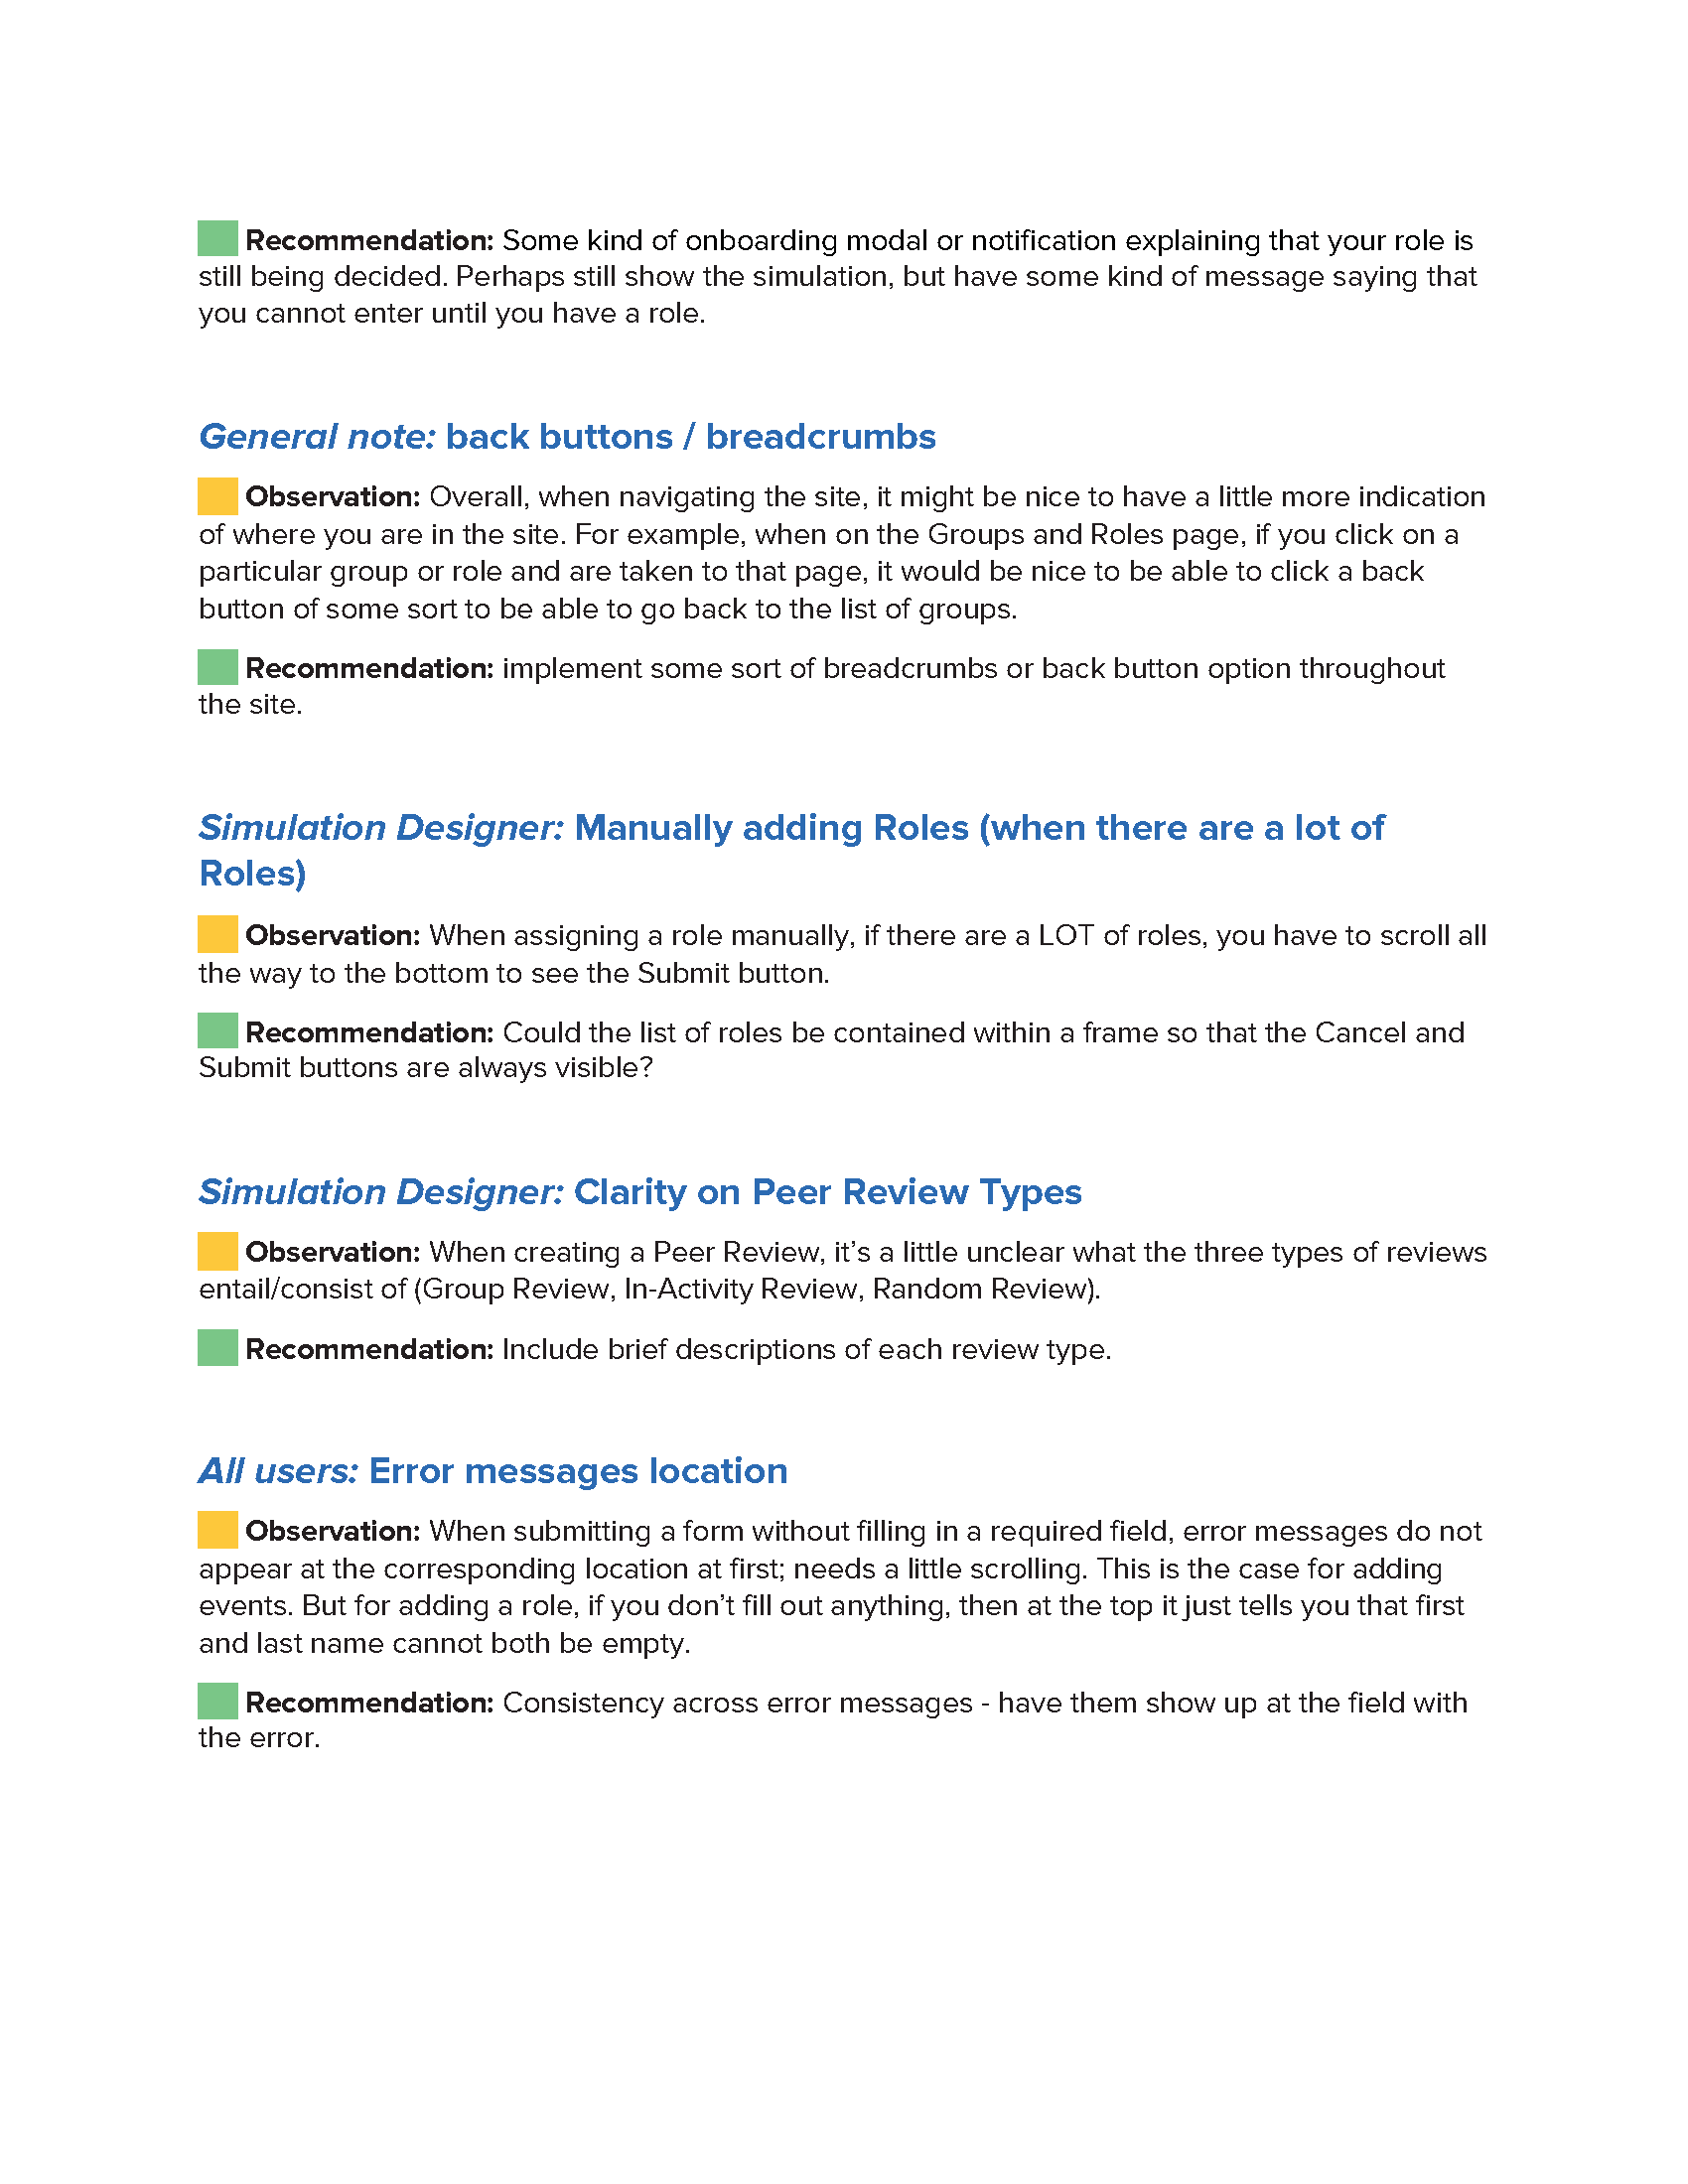
Higher Level Findings
Many of the findings related to:
- Creating consistency in the language/wording used throughout the interface.
- Minimizing the number of steps/clicks it takes to complete tasks.
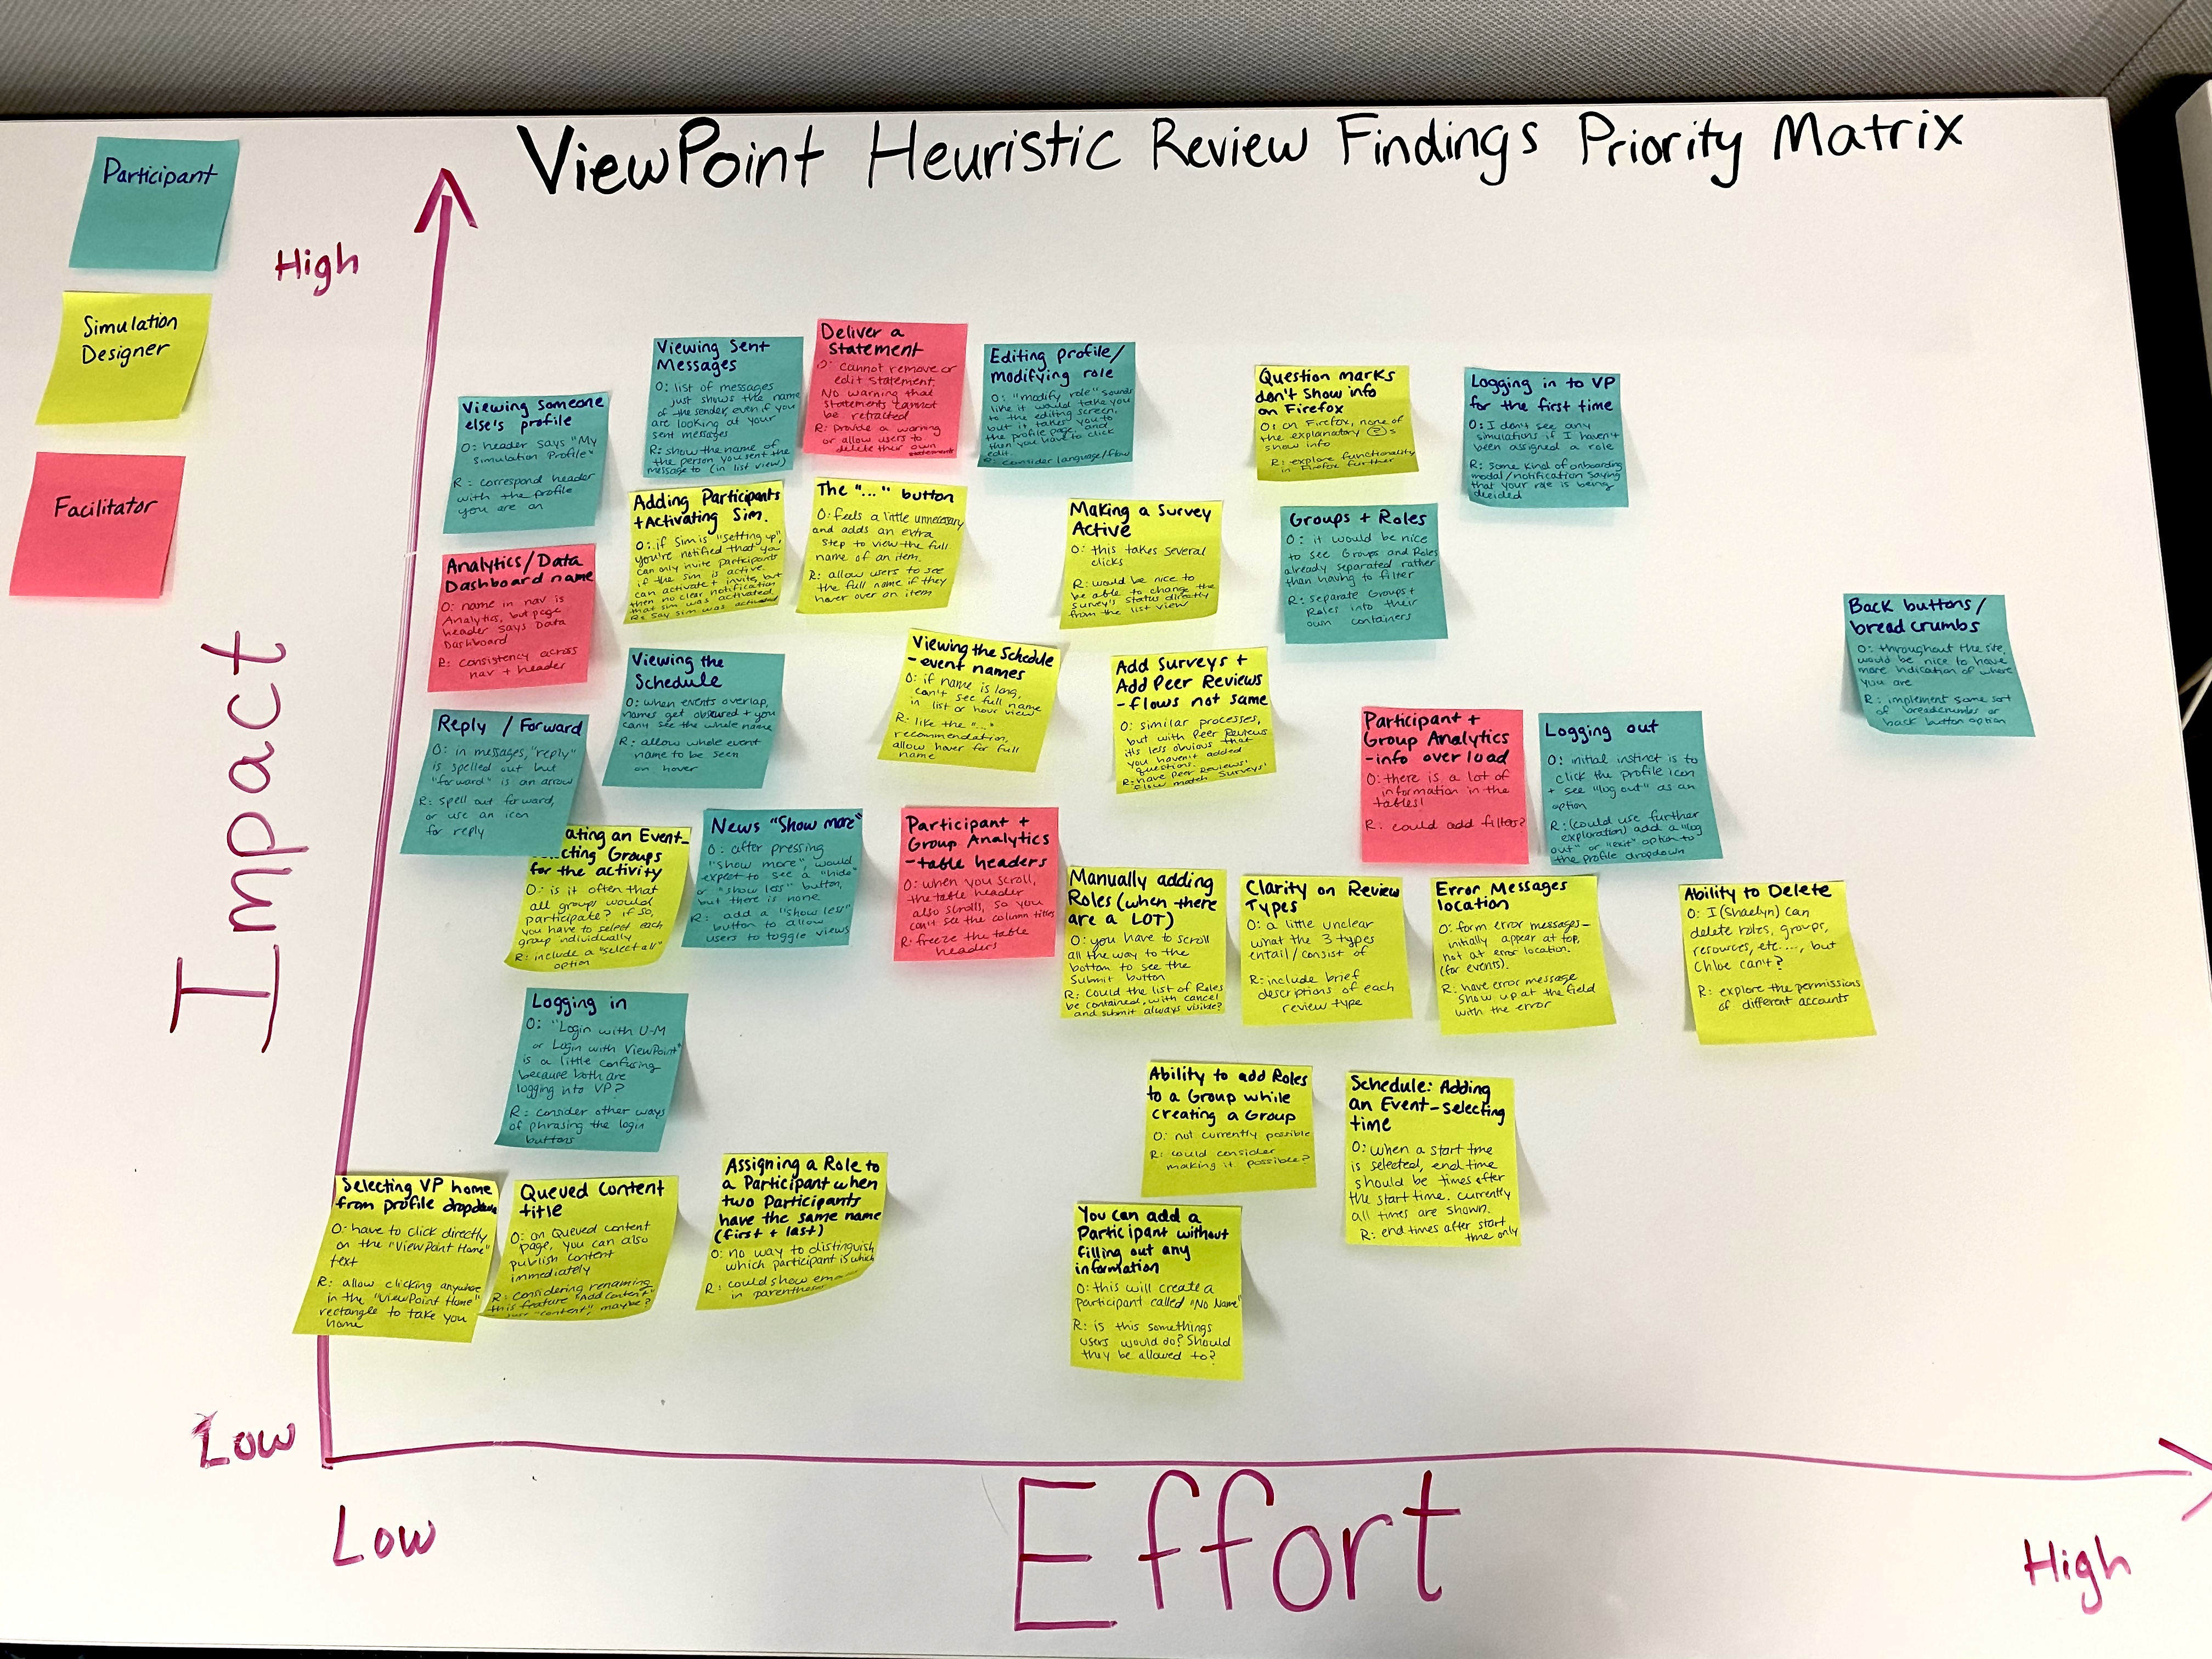
Impact / Priority Matrix
Findings are listed in priority order as was determined by the Impact / Priority Matrix. “Quick Wins” (high impact, low effort) are listed first, followed by larger projects (high impact, high effort), followed by low impact, low effort, and ending with low impact, high effort items. To prioritize the findings, I wrote each finding on a sticky note (color-coded based on the user type - participant, facilitator, or simulation designer), and placed the sticky note on a graph based on how much effort would be required to implement the recommendation and how much of an impact the change would make. After prioritizing the findings, I put together a report that was shared out to my team, and the findings portion of the report is included below.