Citizen Interaction Design
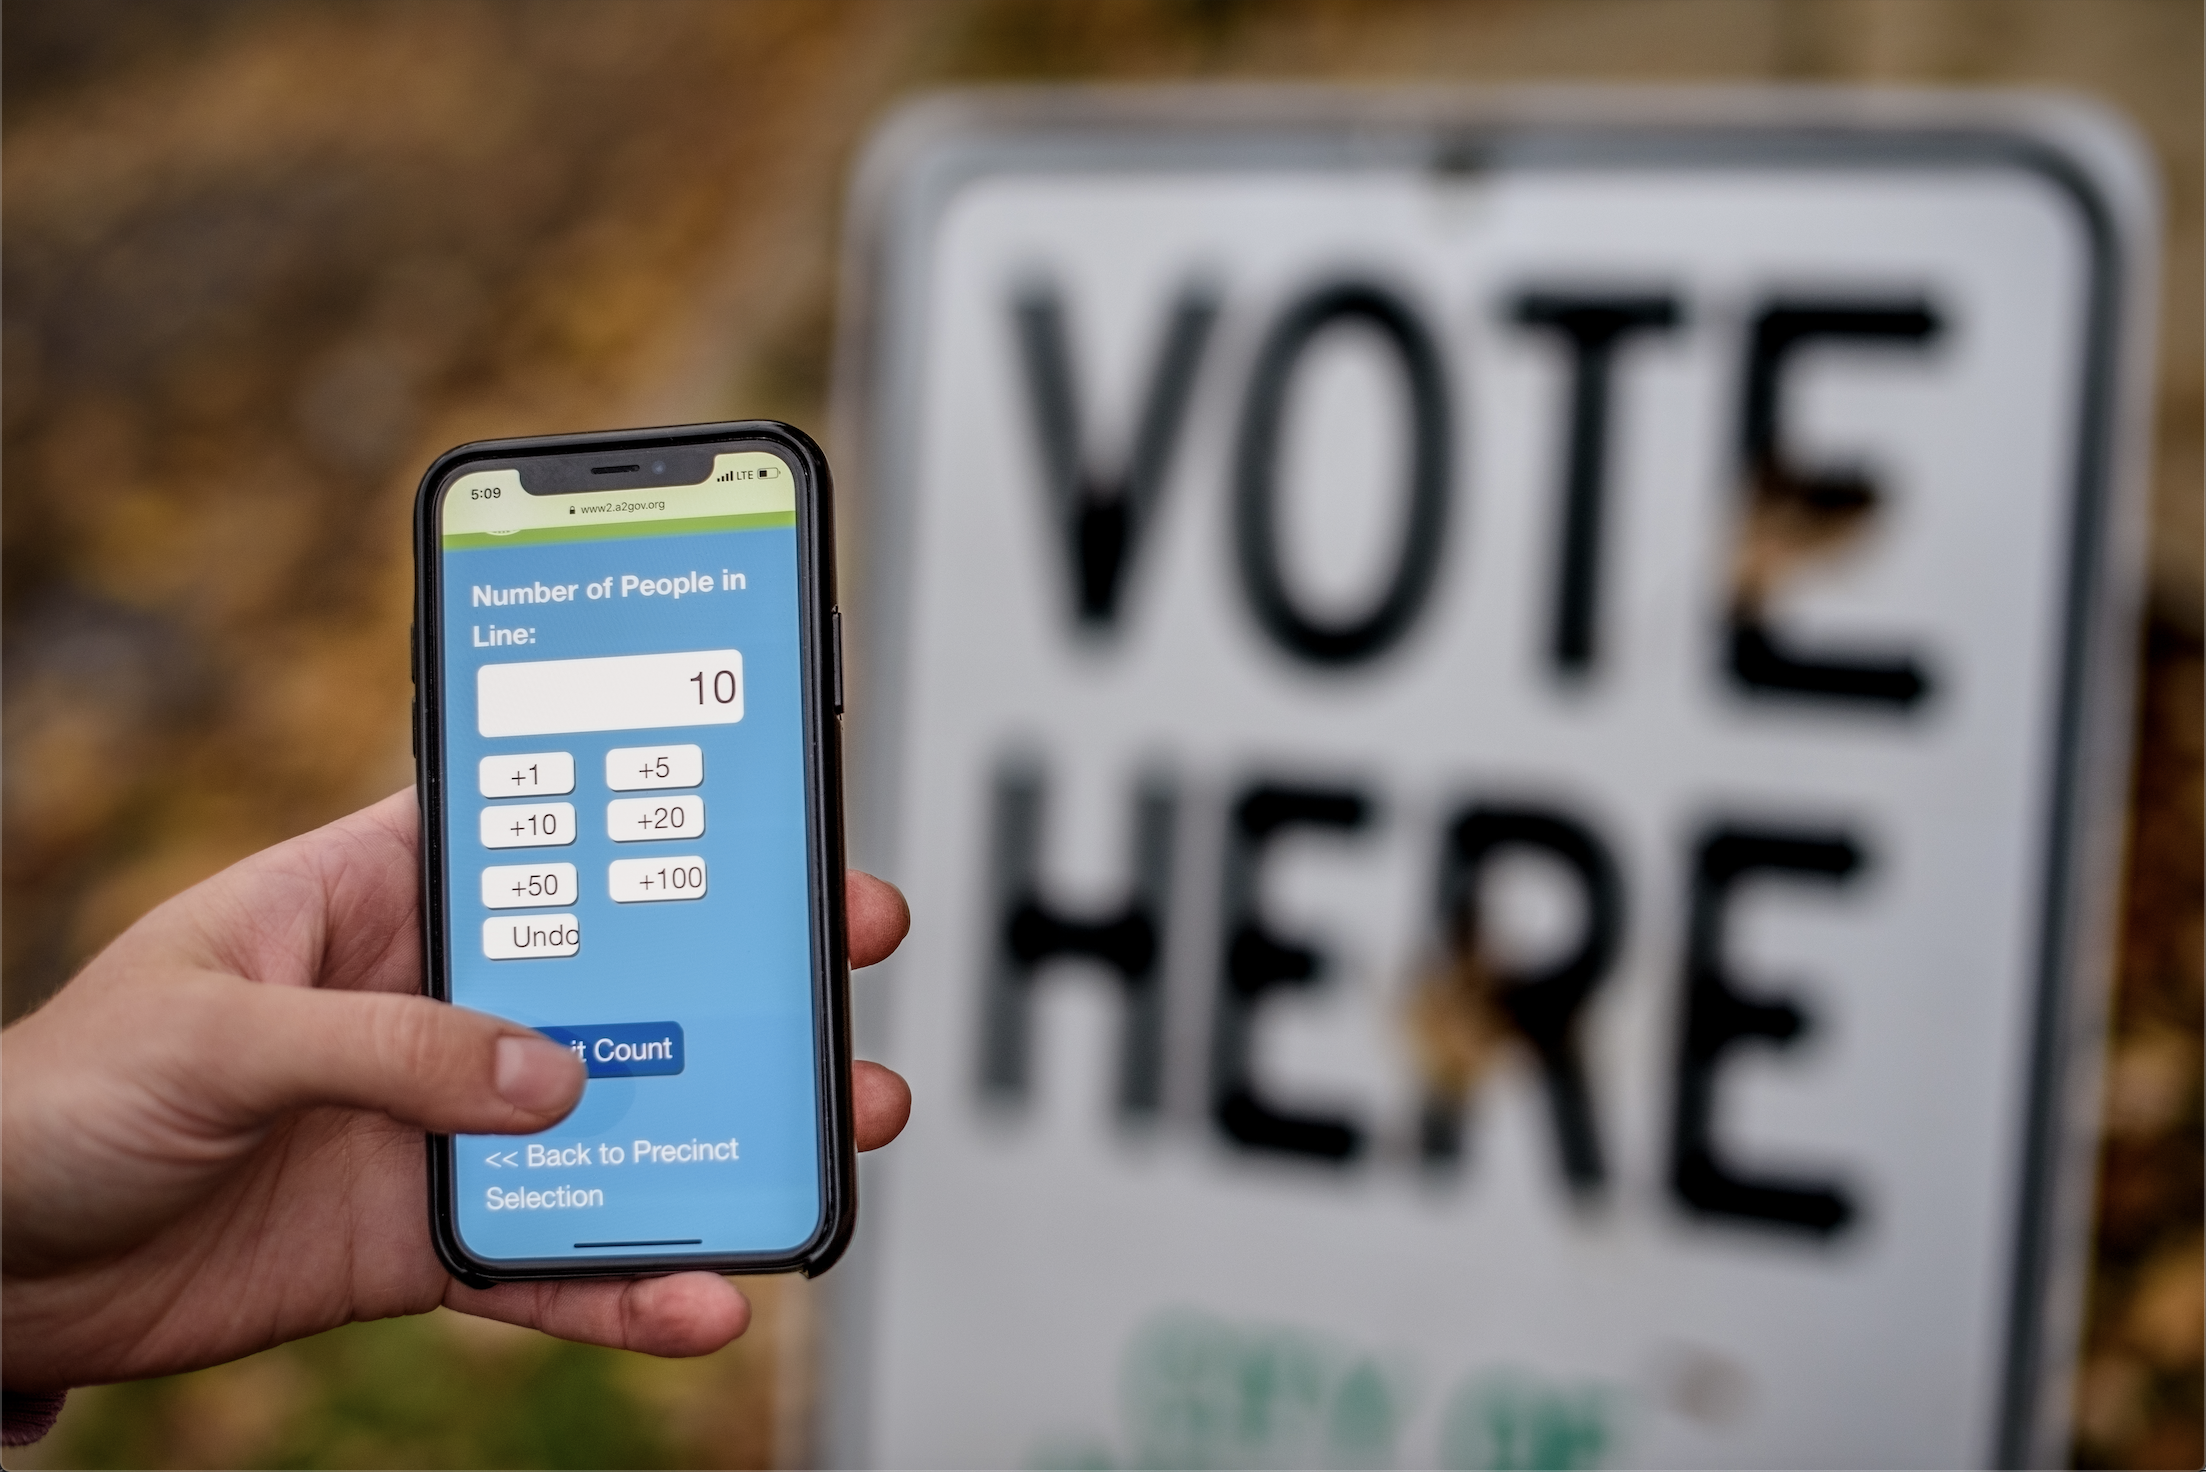
I assisted the City of Ann Arbor in improving the experience of waiting in line to vote during elections by designing a line tracker that updates in real time.
Project Timeline
9-week fellowship throughout May and June of 2018. I worked 20 hours per week alongside a Master's student who worked on the project full-time
Tools
- Sketch
- Marvel
- Python
- Plotly
Skills
- Conducting Interviews
- Affinity Mapping
- Survey Design
- Developing Personas
- Paper Prototyping
- Digital Prototyping
What is the Citizen Interaction Design Summer Fellowship?
Citizen Interaction Design (CID) partners local governments in Michigan with students at the University of Michigan School of Information. Together, the goal is to develop new information tools that support citizens’ engagement with their community and local government. You can learn more at citizeninteraction.org.
My Fellowship
As a CID Junior Fellow, I partnered with the Ann Arbor City Clerk’s Office to explore how the city could expedite line management and improve the voter experience, particularly in on-campus precincts. The School of Information did a short story on my internship; check it out by clicking the button below!
Read the storyThe Problem
In the 2016 elections, voting wait times at on-campus precincts greatly exceeded the 30 minute time limit recommended by the government.
The Goal
Throughout the 9-week internship, the goal was to design a solution that would both help better understand voter turnout behavior and use technology to manage lines.
Brainstorming and Competitive Analysis
My project partner and I constantly bounced ideas off each other. Before diving into the process, we had a brainstorming session where no idea was too crazy; we considered all possibilities, and we also looked at how other places handle lines. For example, Disney sends characters around to entertain guests while waiting in line; could we provide entertainment for the voters while they waited? Would voters want to use an app while waiting in line? Would some sort of technology aid the poll-workers in streamlining the voting process?
Through conversations with the Ann Arbor Clerk, and after brainstorming, we knew there were two potential user groups we could design for: the voters themselves, or the poll-workers who work at the polling locations. We envisioned a tool where the voters would be able to check the line length before going to their precinct, but a barrier to this tool was the fact that the City did not have a data collection method for gathering the line length. Due to the brevity of the internship, it was vital to narrow the scope to one of these user groups, and we began to think about how a tool for the poll-workers could improve the overall voting experience.
Working with Existing Data
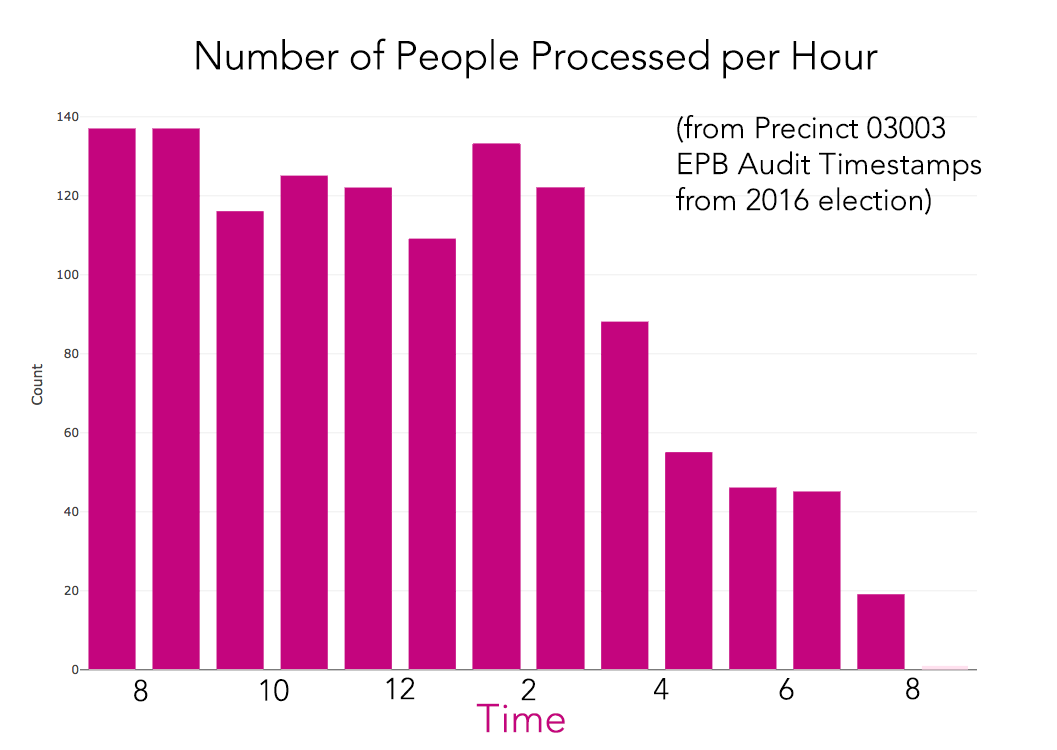
The one form of technology that the city did use already was electronic poll-books (EPBs). The EPBs record the time that each voter checks in to the precinct.
I wrote a Python program that read in timestamp data from the EPB audits and then used Plotly to produce histograms showing the number of people processed by the EPB per hour. This visualization was helpful because the number of people processed per hour relates to the number of people who were at the polls each hour. I was able to pass in a certain precinct's data and create a histogram, and I did this for several different precincts.
The Clerk's office was surprised by some of the peaks in the histograms; they weren't always at the times that the office had been publicly saying were the busiest, so this insight highlighted how certain precincts might have very different profiles from others.
The Process
We developed a three-phase project comprising of contextual inquiry, surveying, and design. Each project phase took 3 weeks. We worked closely with the city clerk's office to get a good grasp of the problem statement and to narrow our scope. Ultimately we decided to design for poll-workers because, as a first step towards improving voters' overall experience at the polls, the city needed a clearer quantitative understanding of their current line-management.
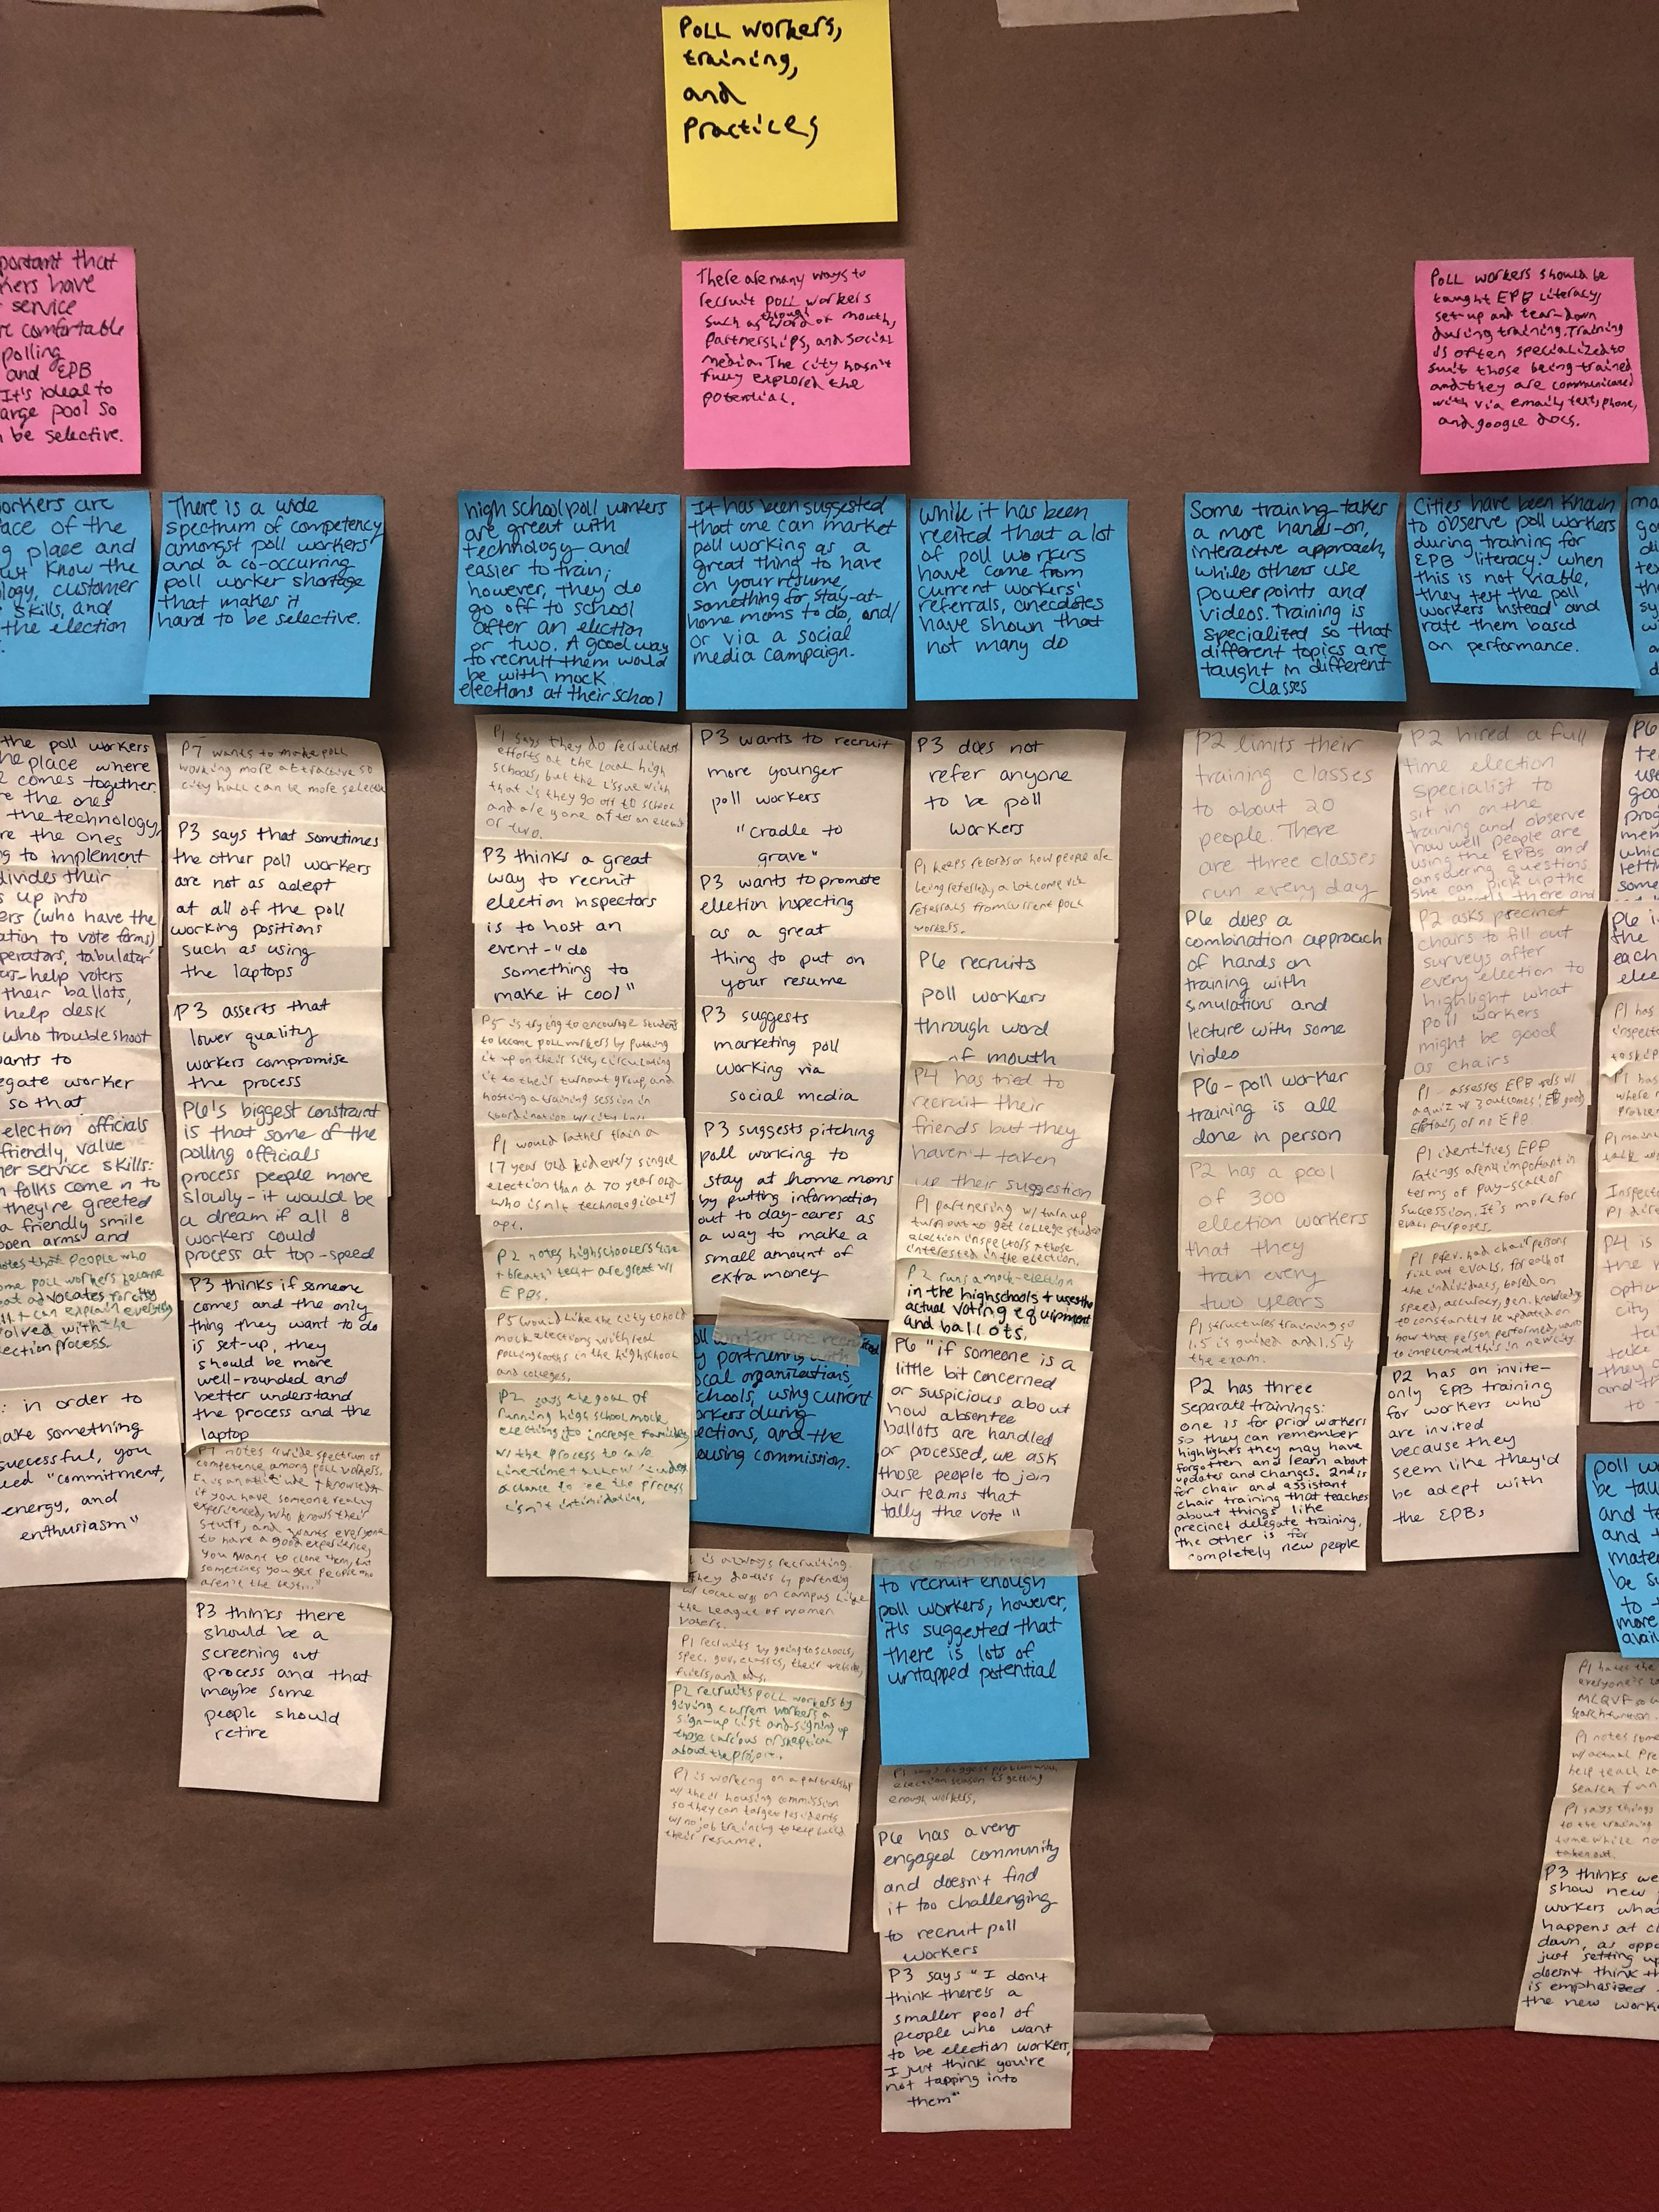
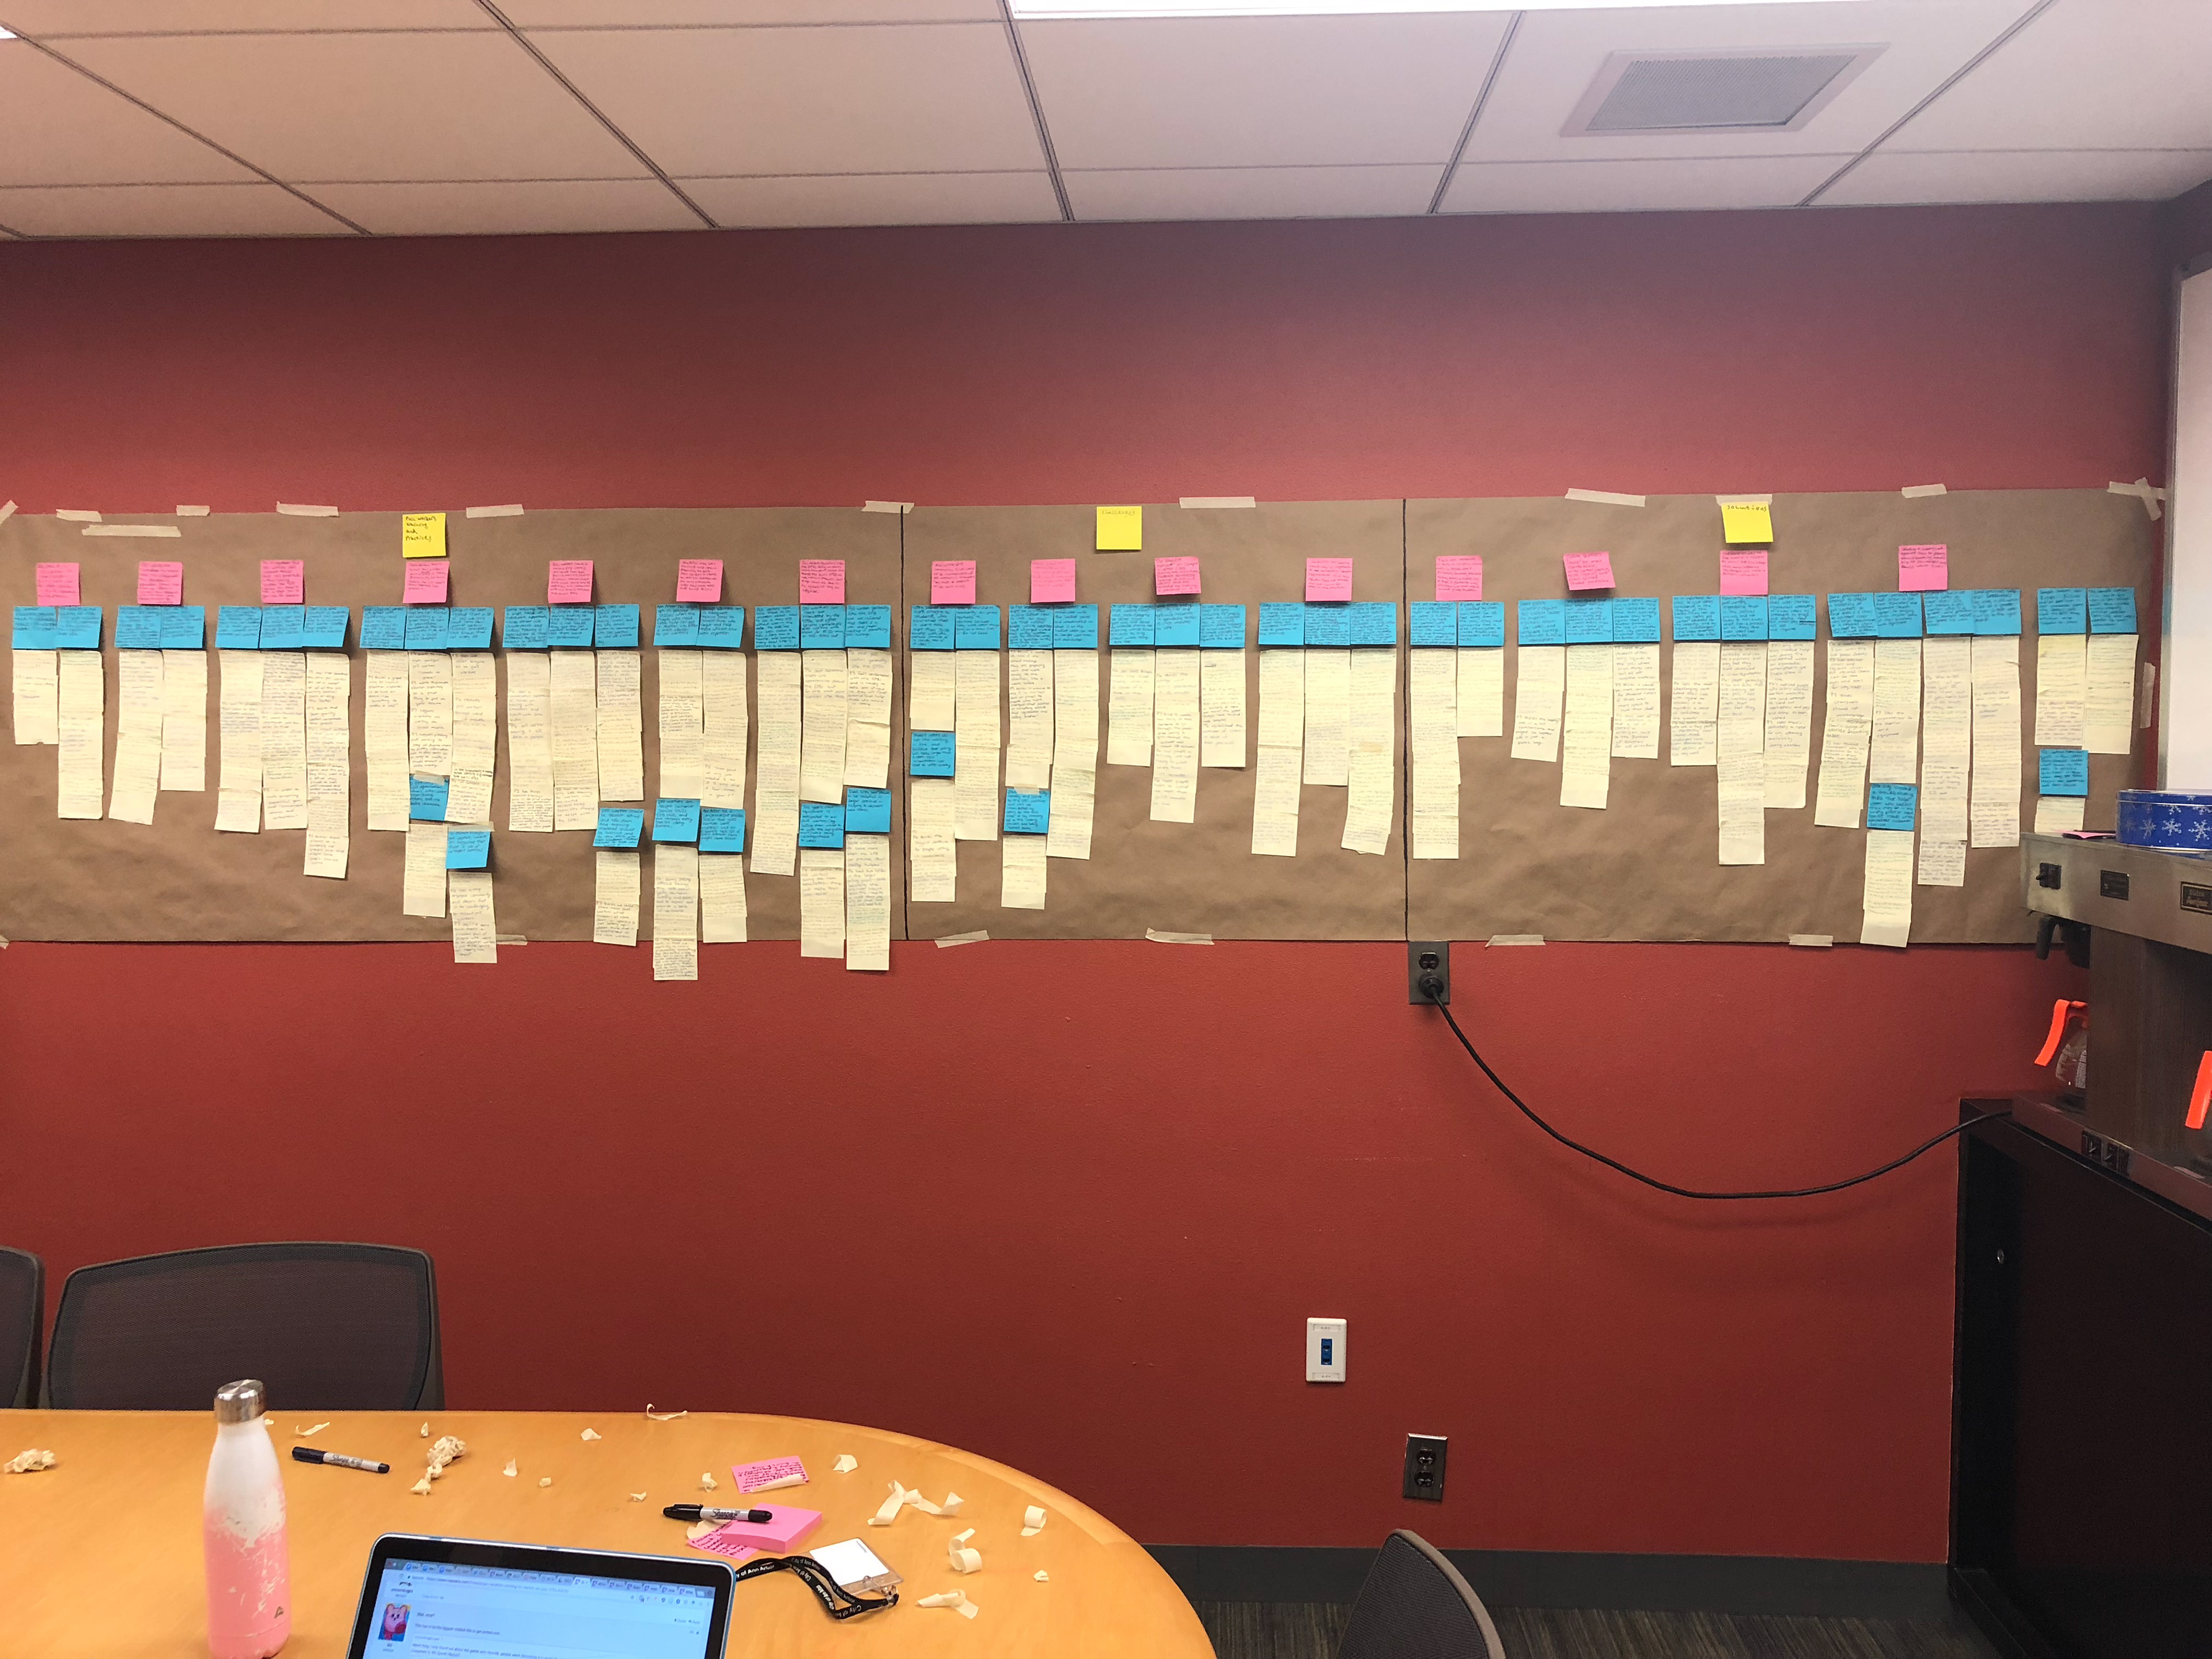
We held interviews with key stakeholders including city hall staff, poll workers, and clerks of other cities and towns in Michigan. This led to building an affinity wall, which informed key questions and findings for the rest of the project.
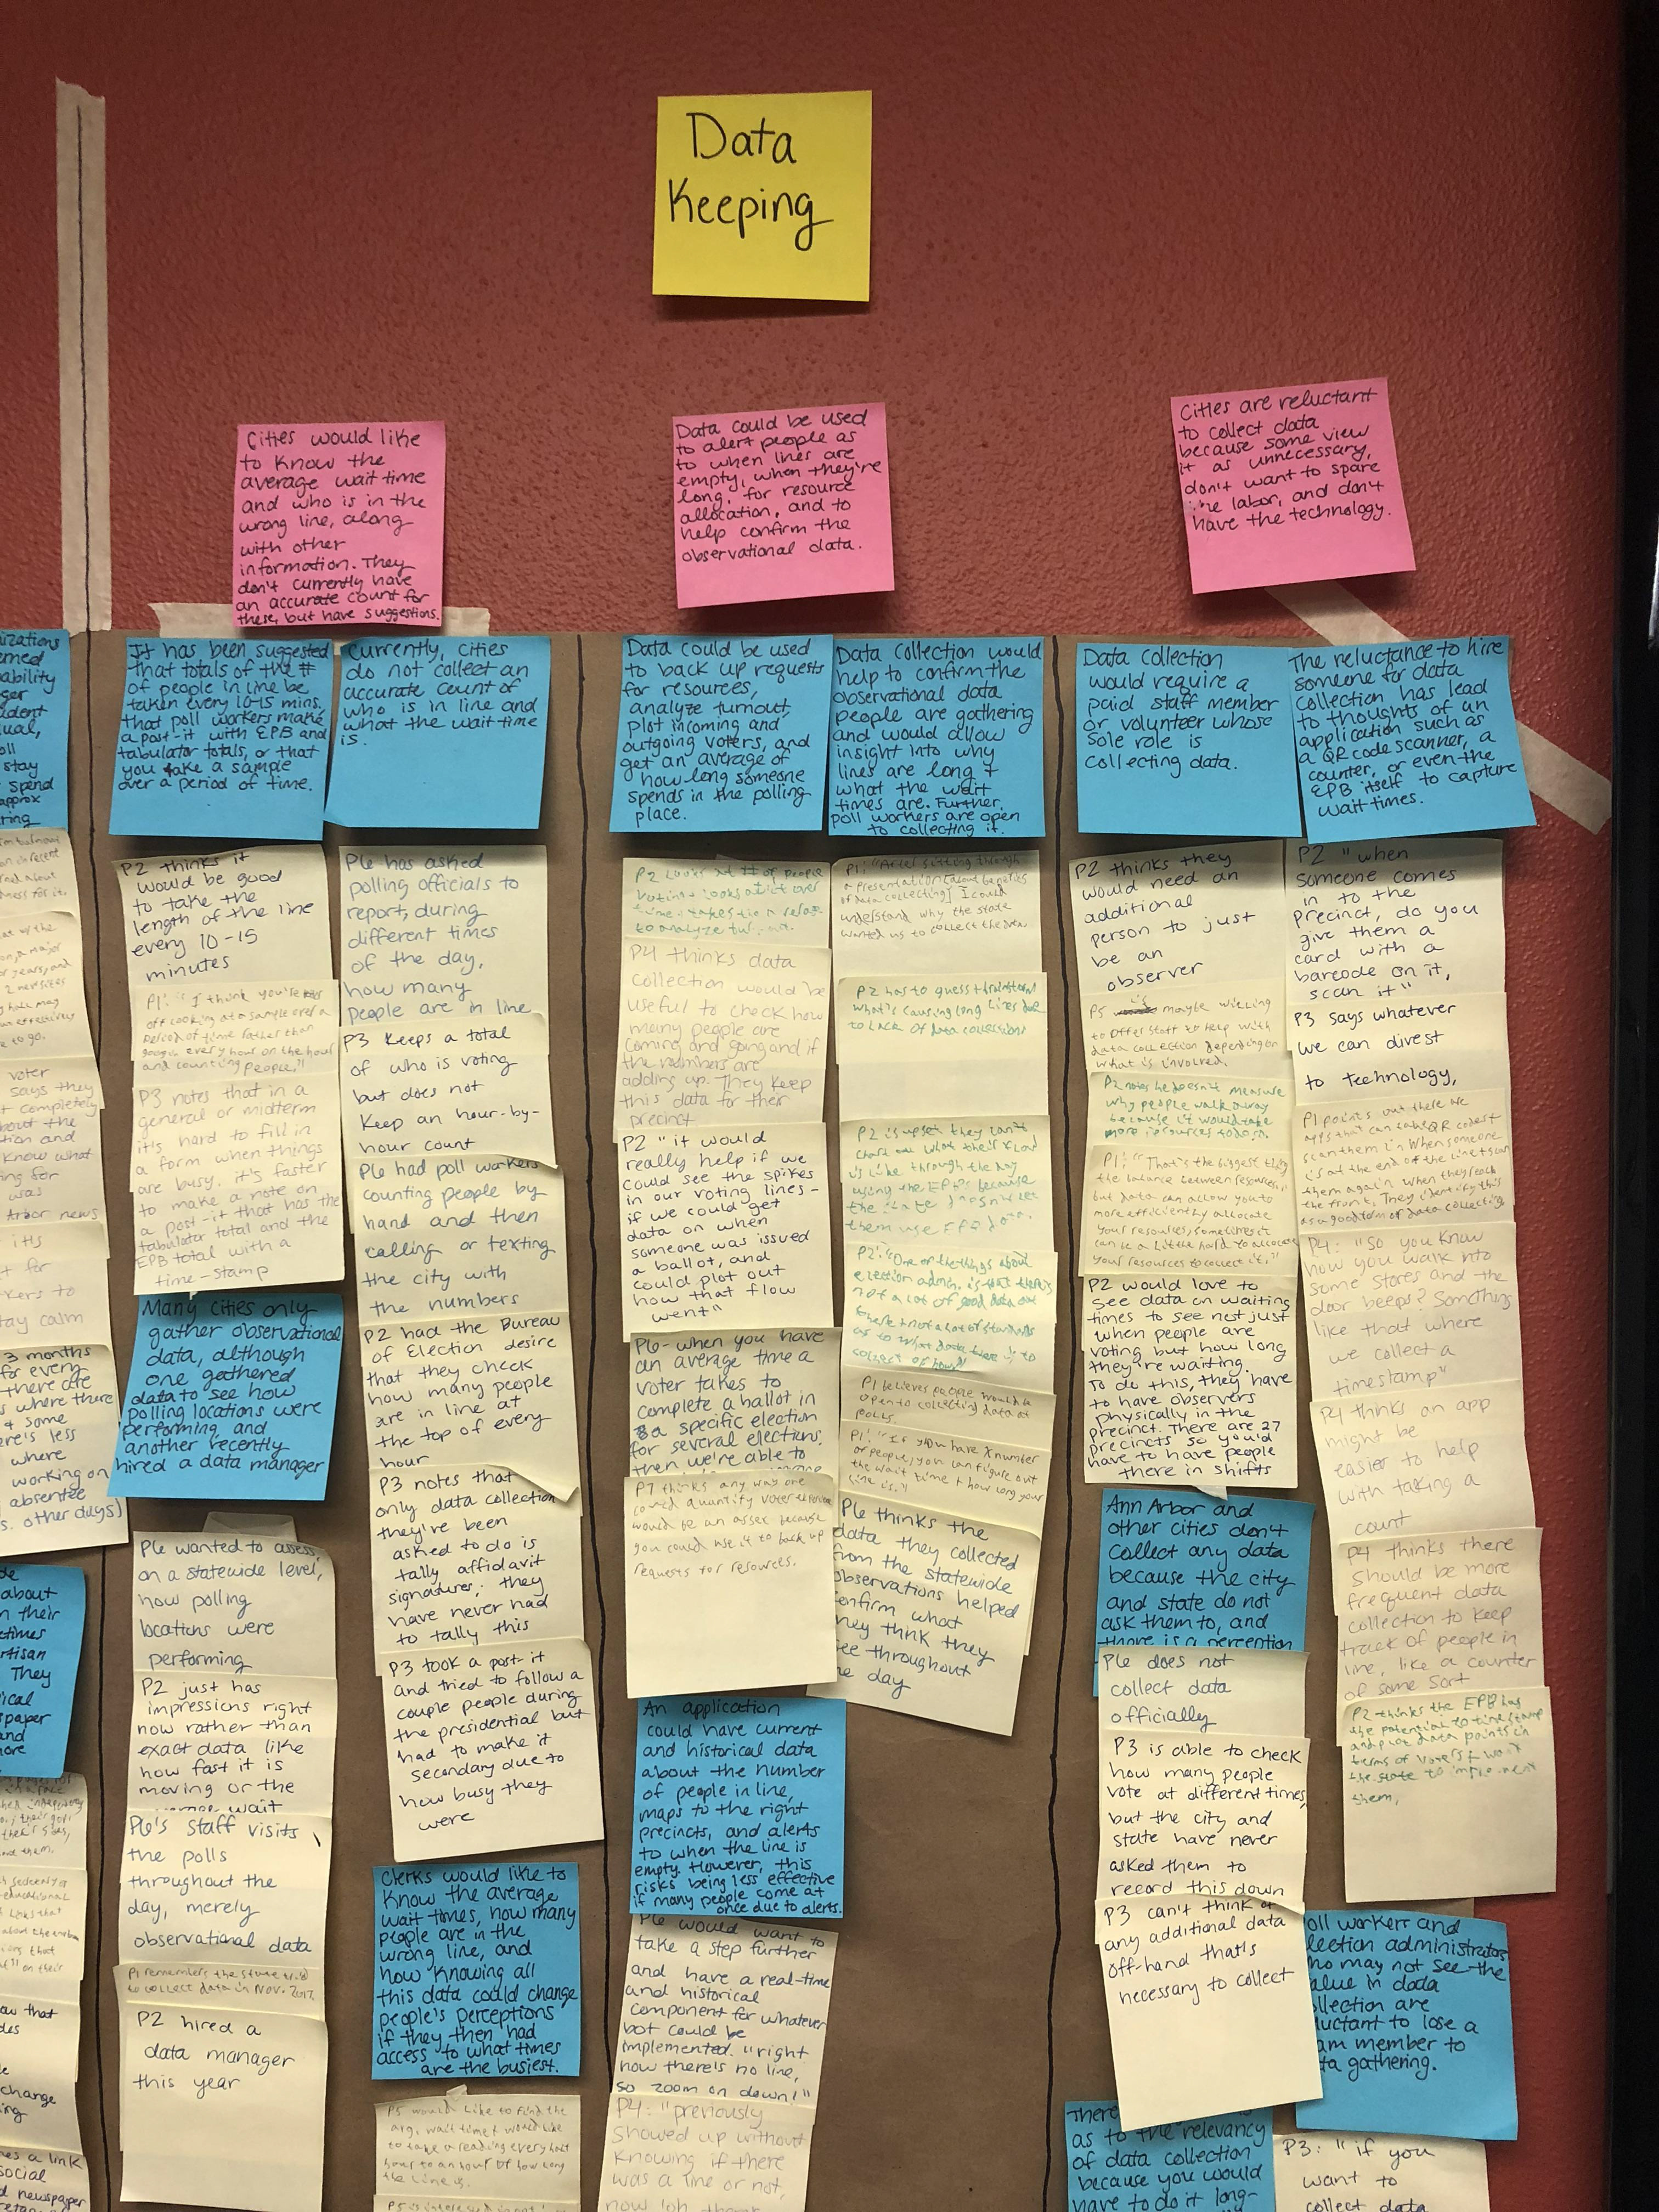
Key Findings From Analyzing Interview Notes
- Many election officials shared a common perspective that counting the line was important, but noted that they often did not have Election Day resources to allocate to line management tasks, especially counting and tracking line data.
- Many likely voters acknowledged that they would appreciate having information about Election Day waits prior to their arrival at the polling place.
- Designing for poll workers is more feasible than designing for voters since you don’t have to solicit their involvement.
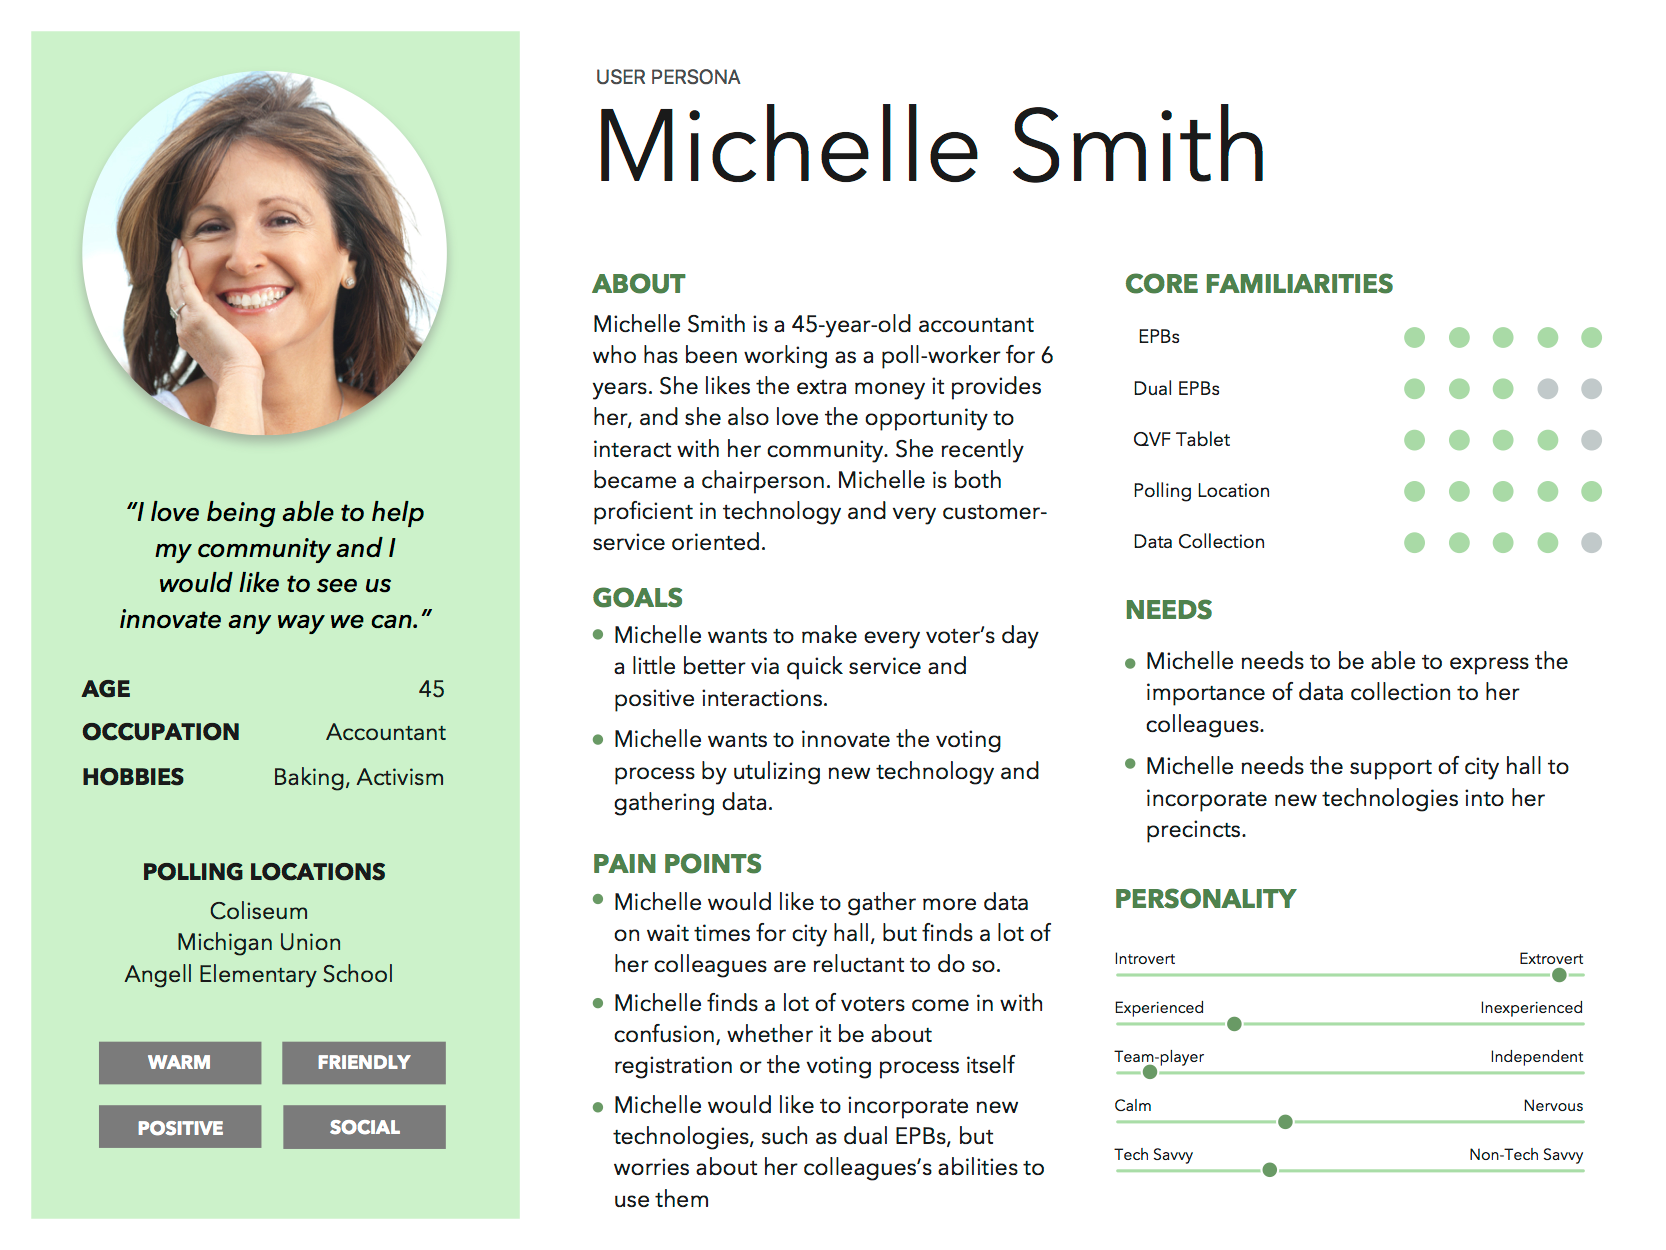
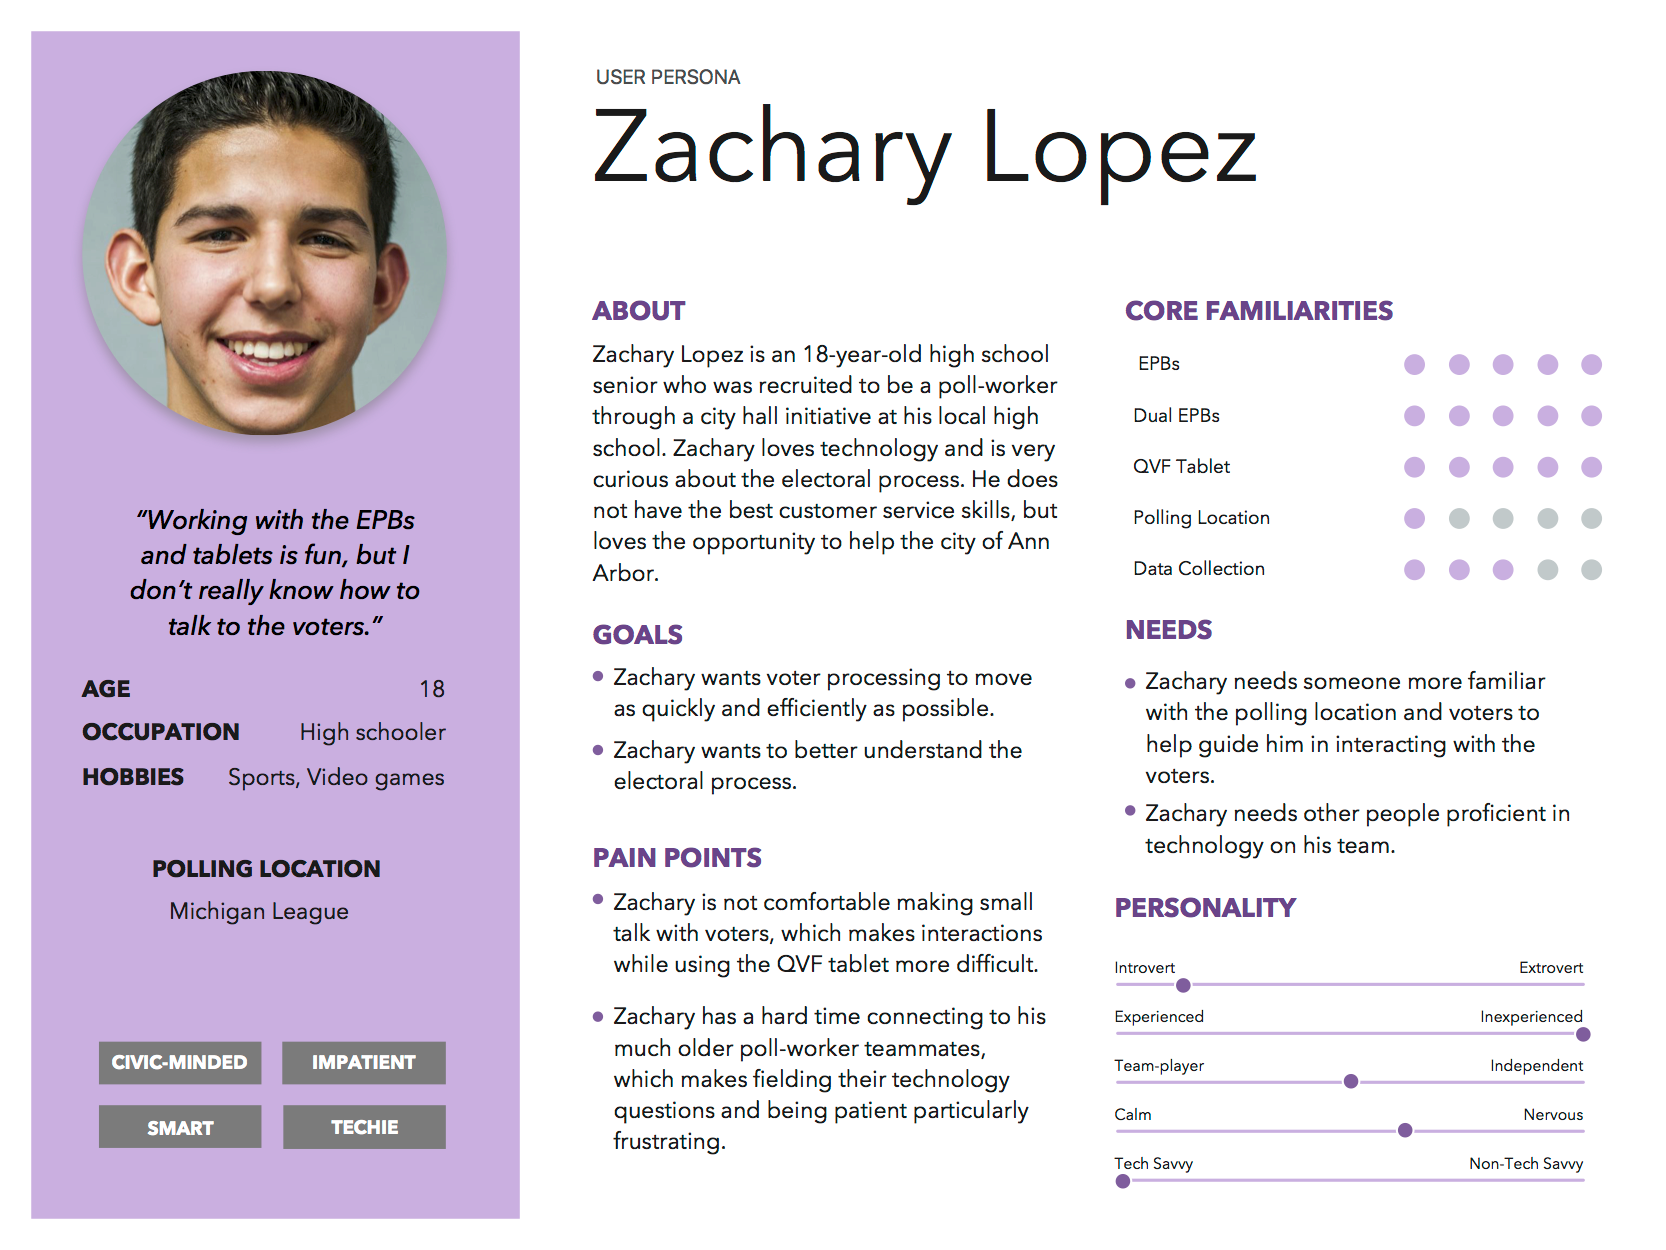
Thinking About Users
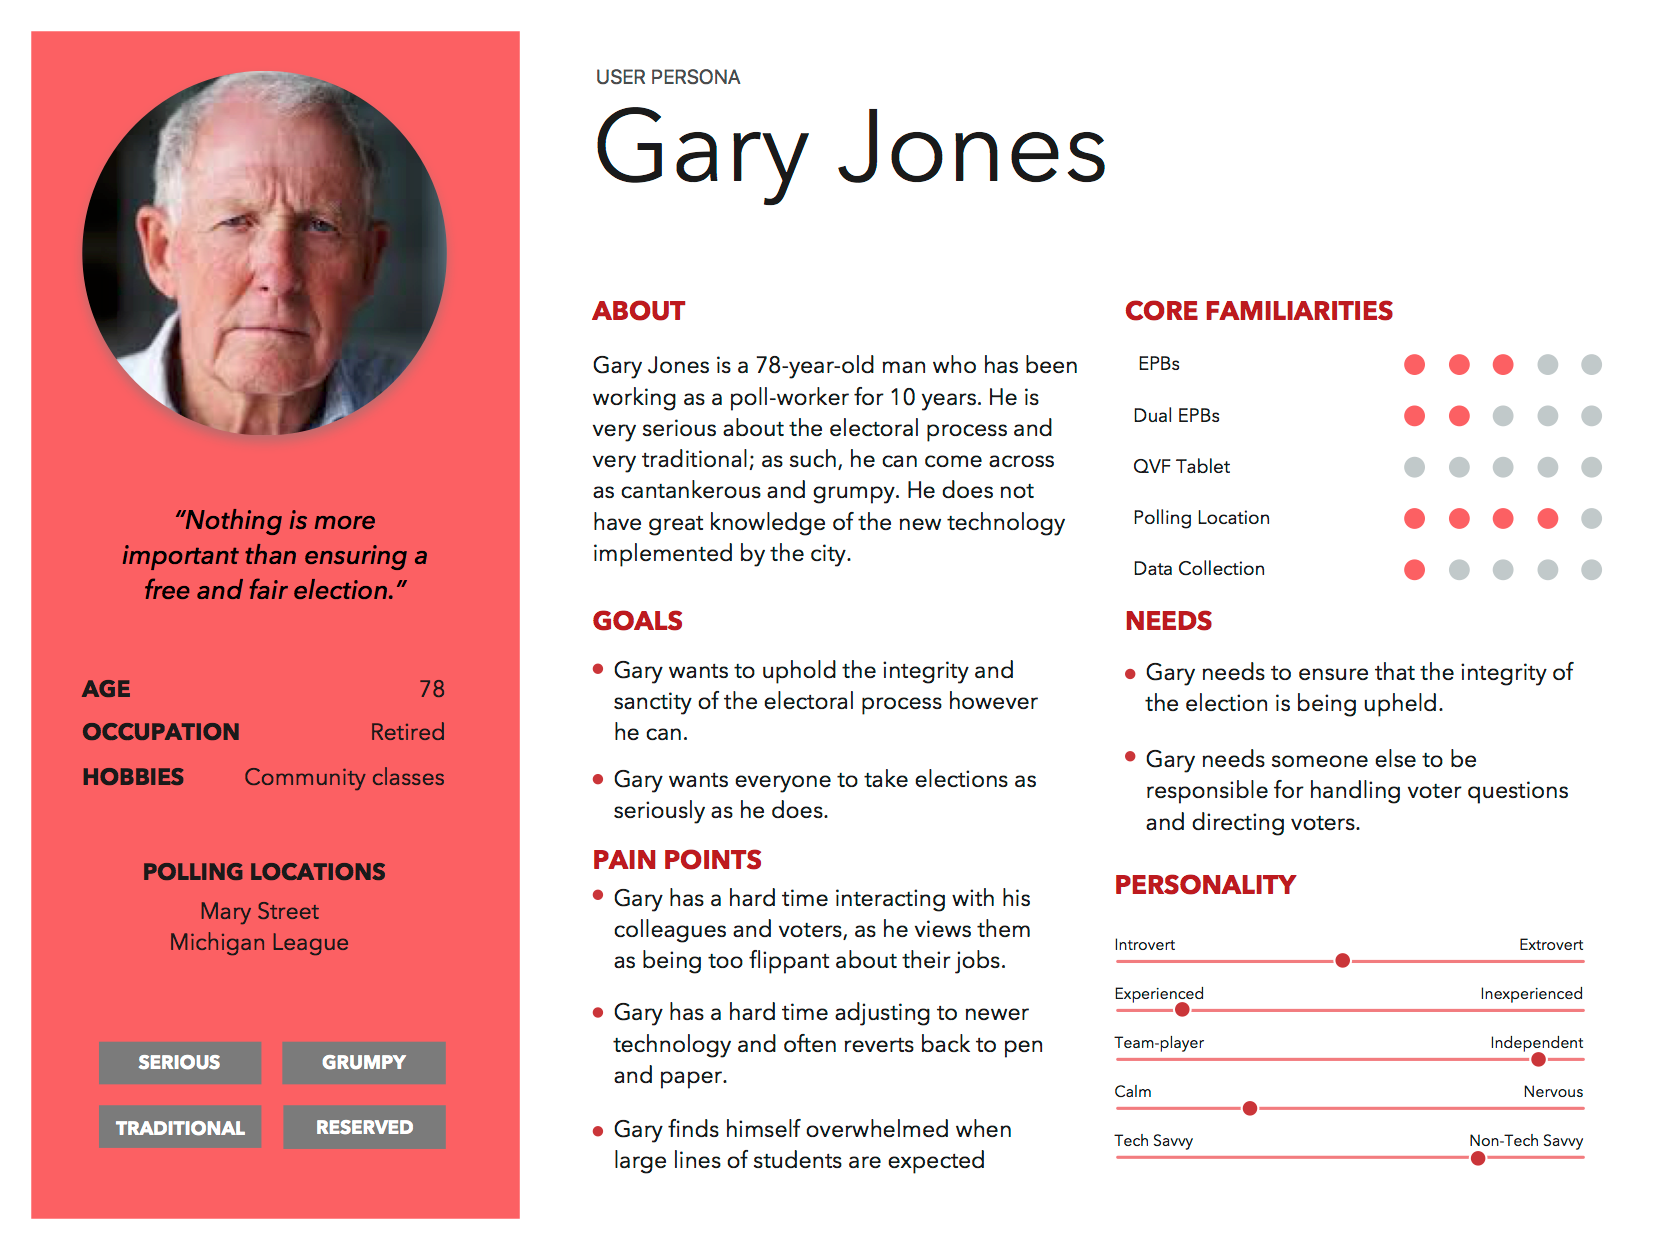
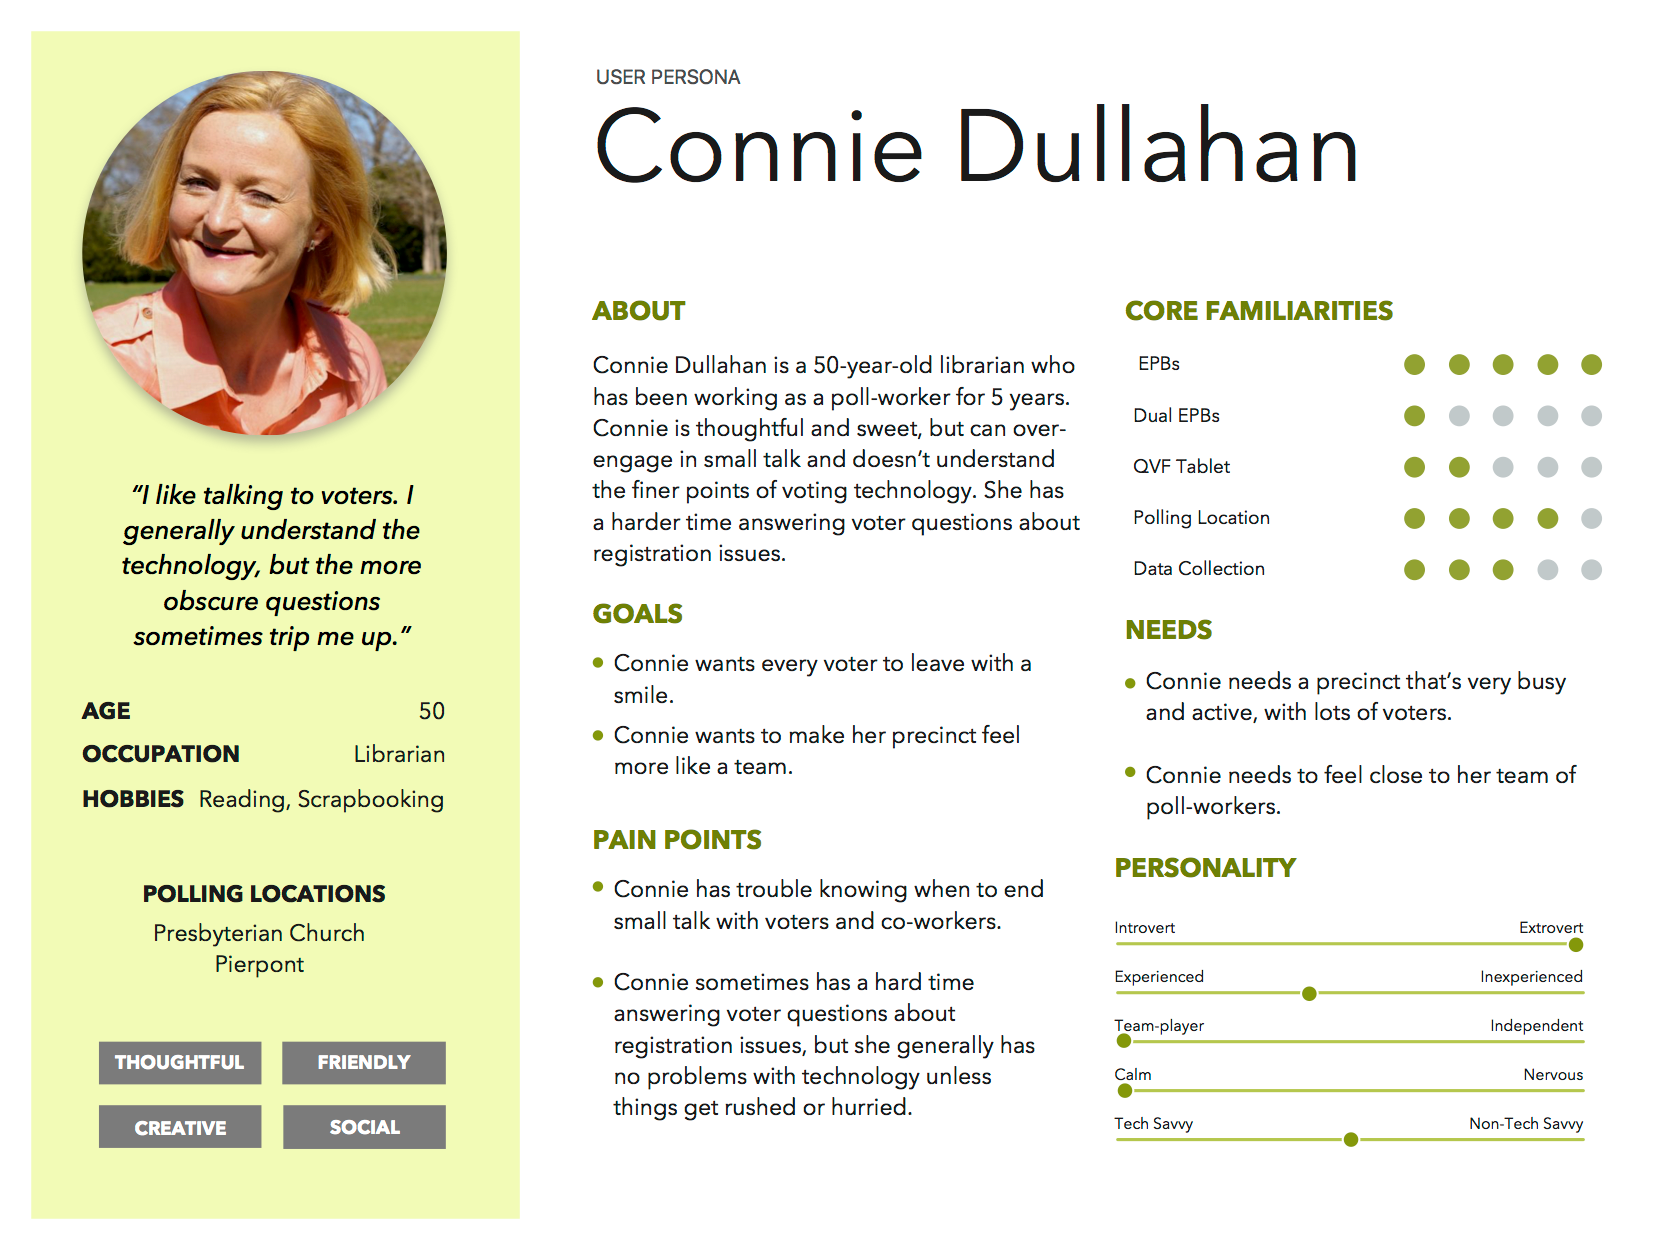
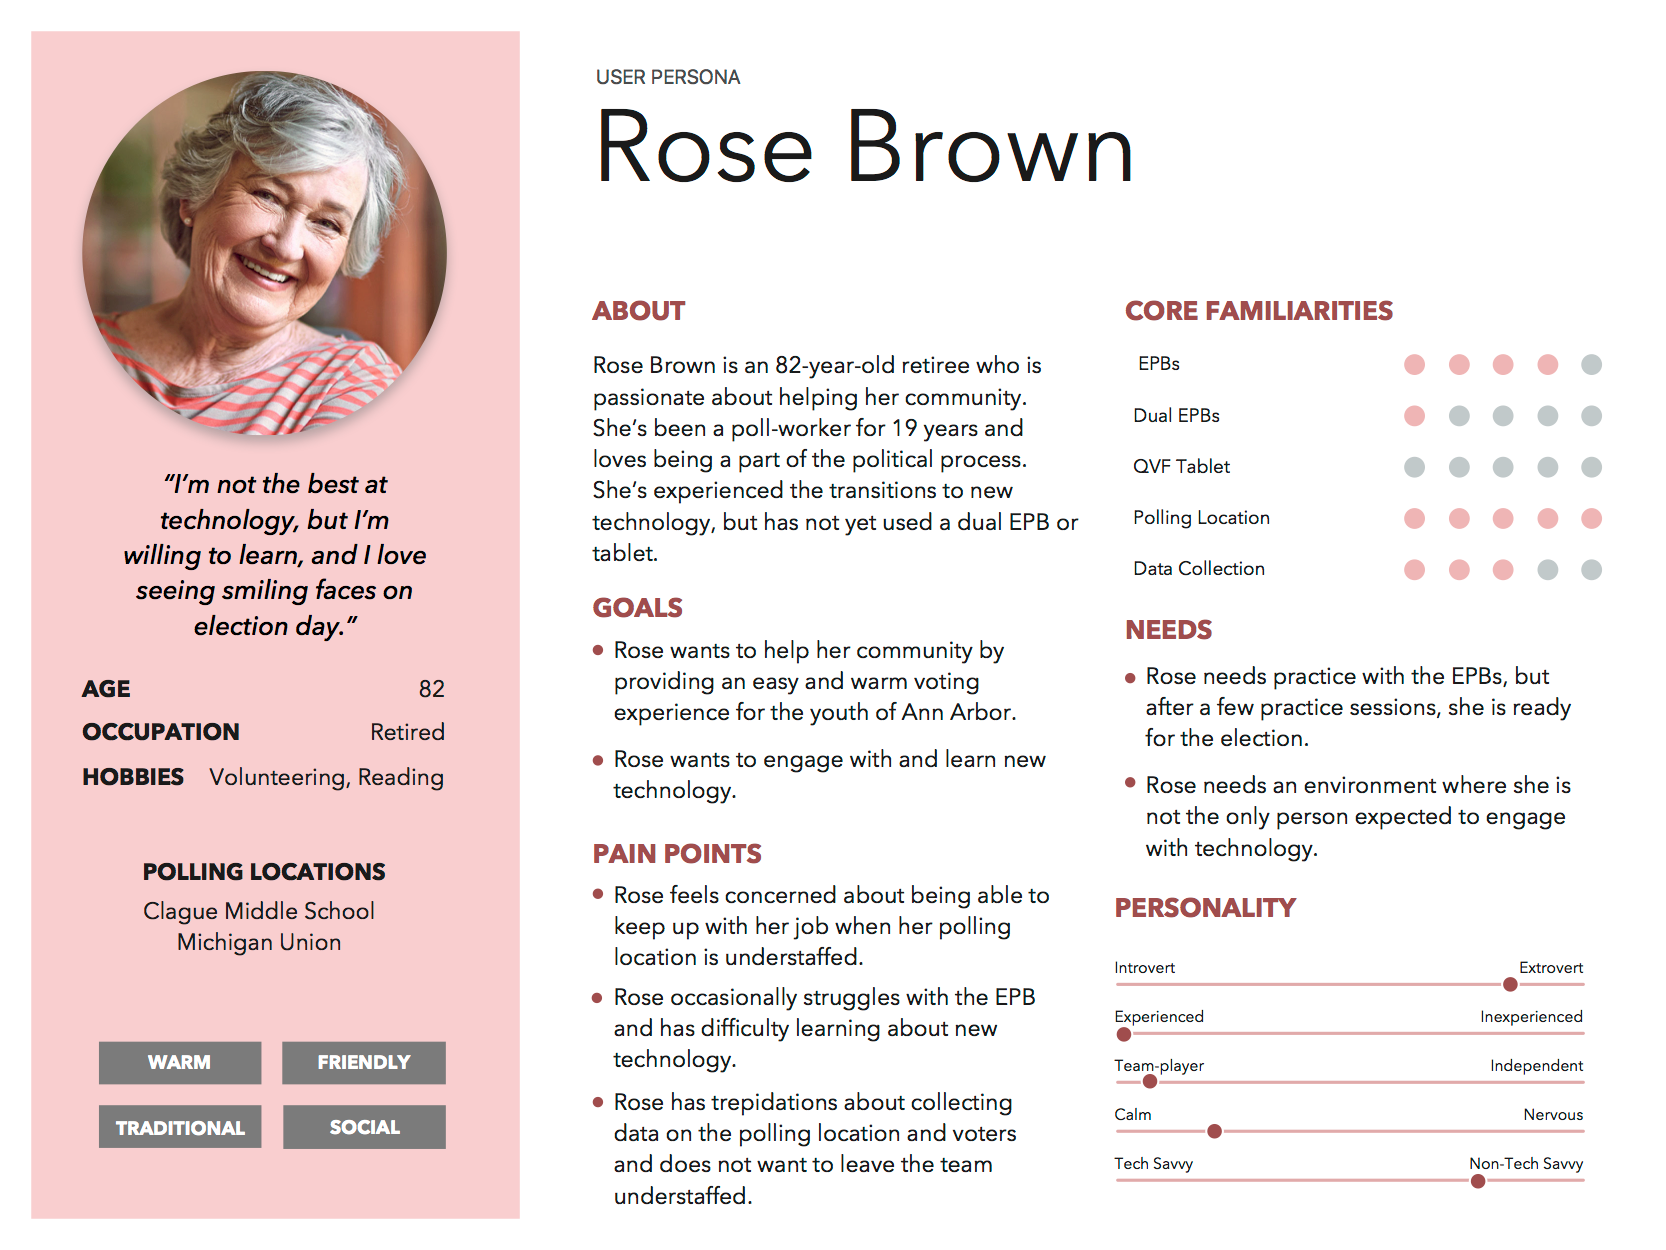
Along with the key findings above, we developed several personas (included below) based on the interviews we conducted with poll-workers. These personas helped us think about the range of people who might interact with our solution, and they also helped the city clerk better understand the poll-workers she manages.
Paper Prototyping
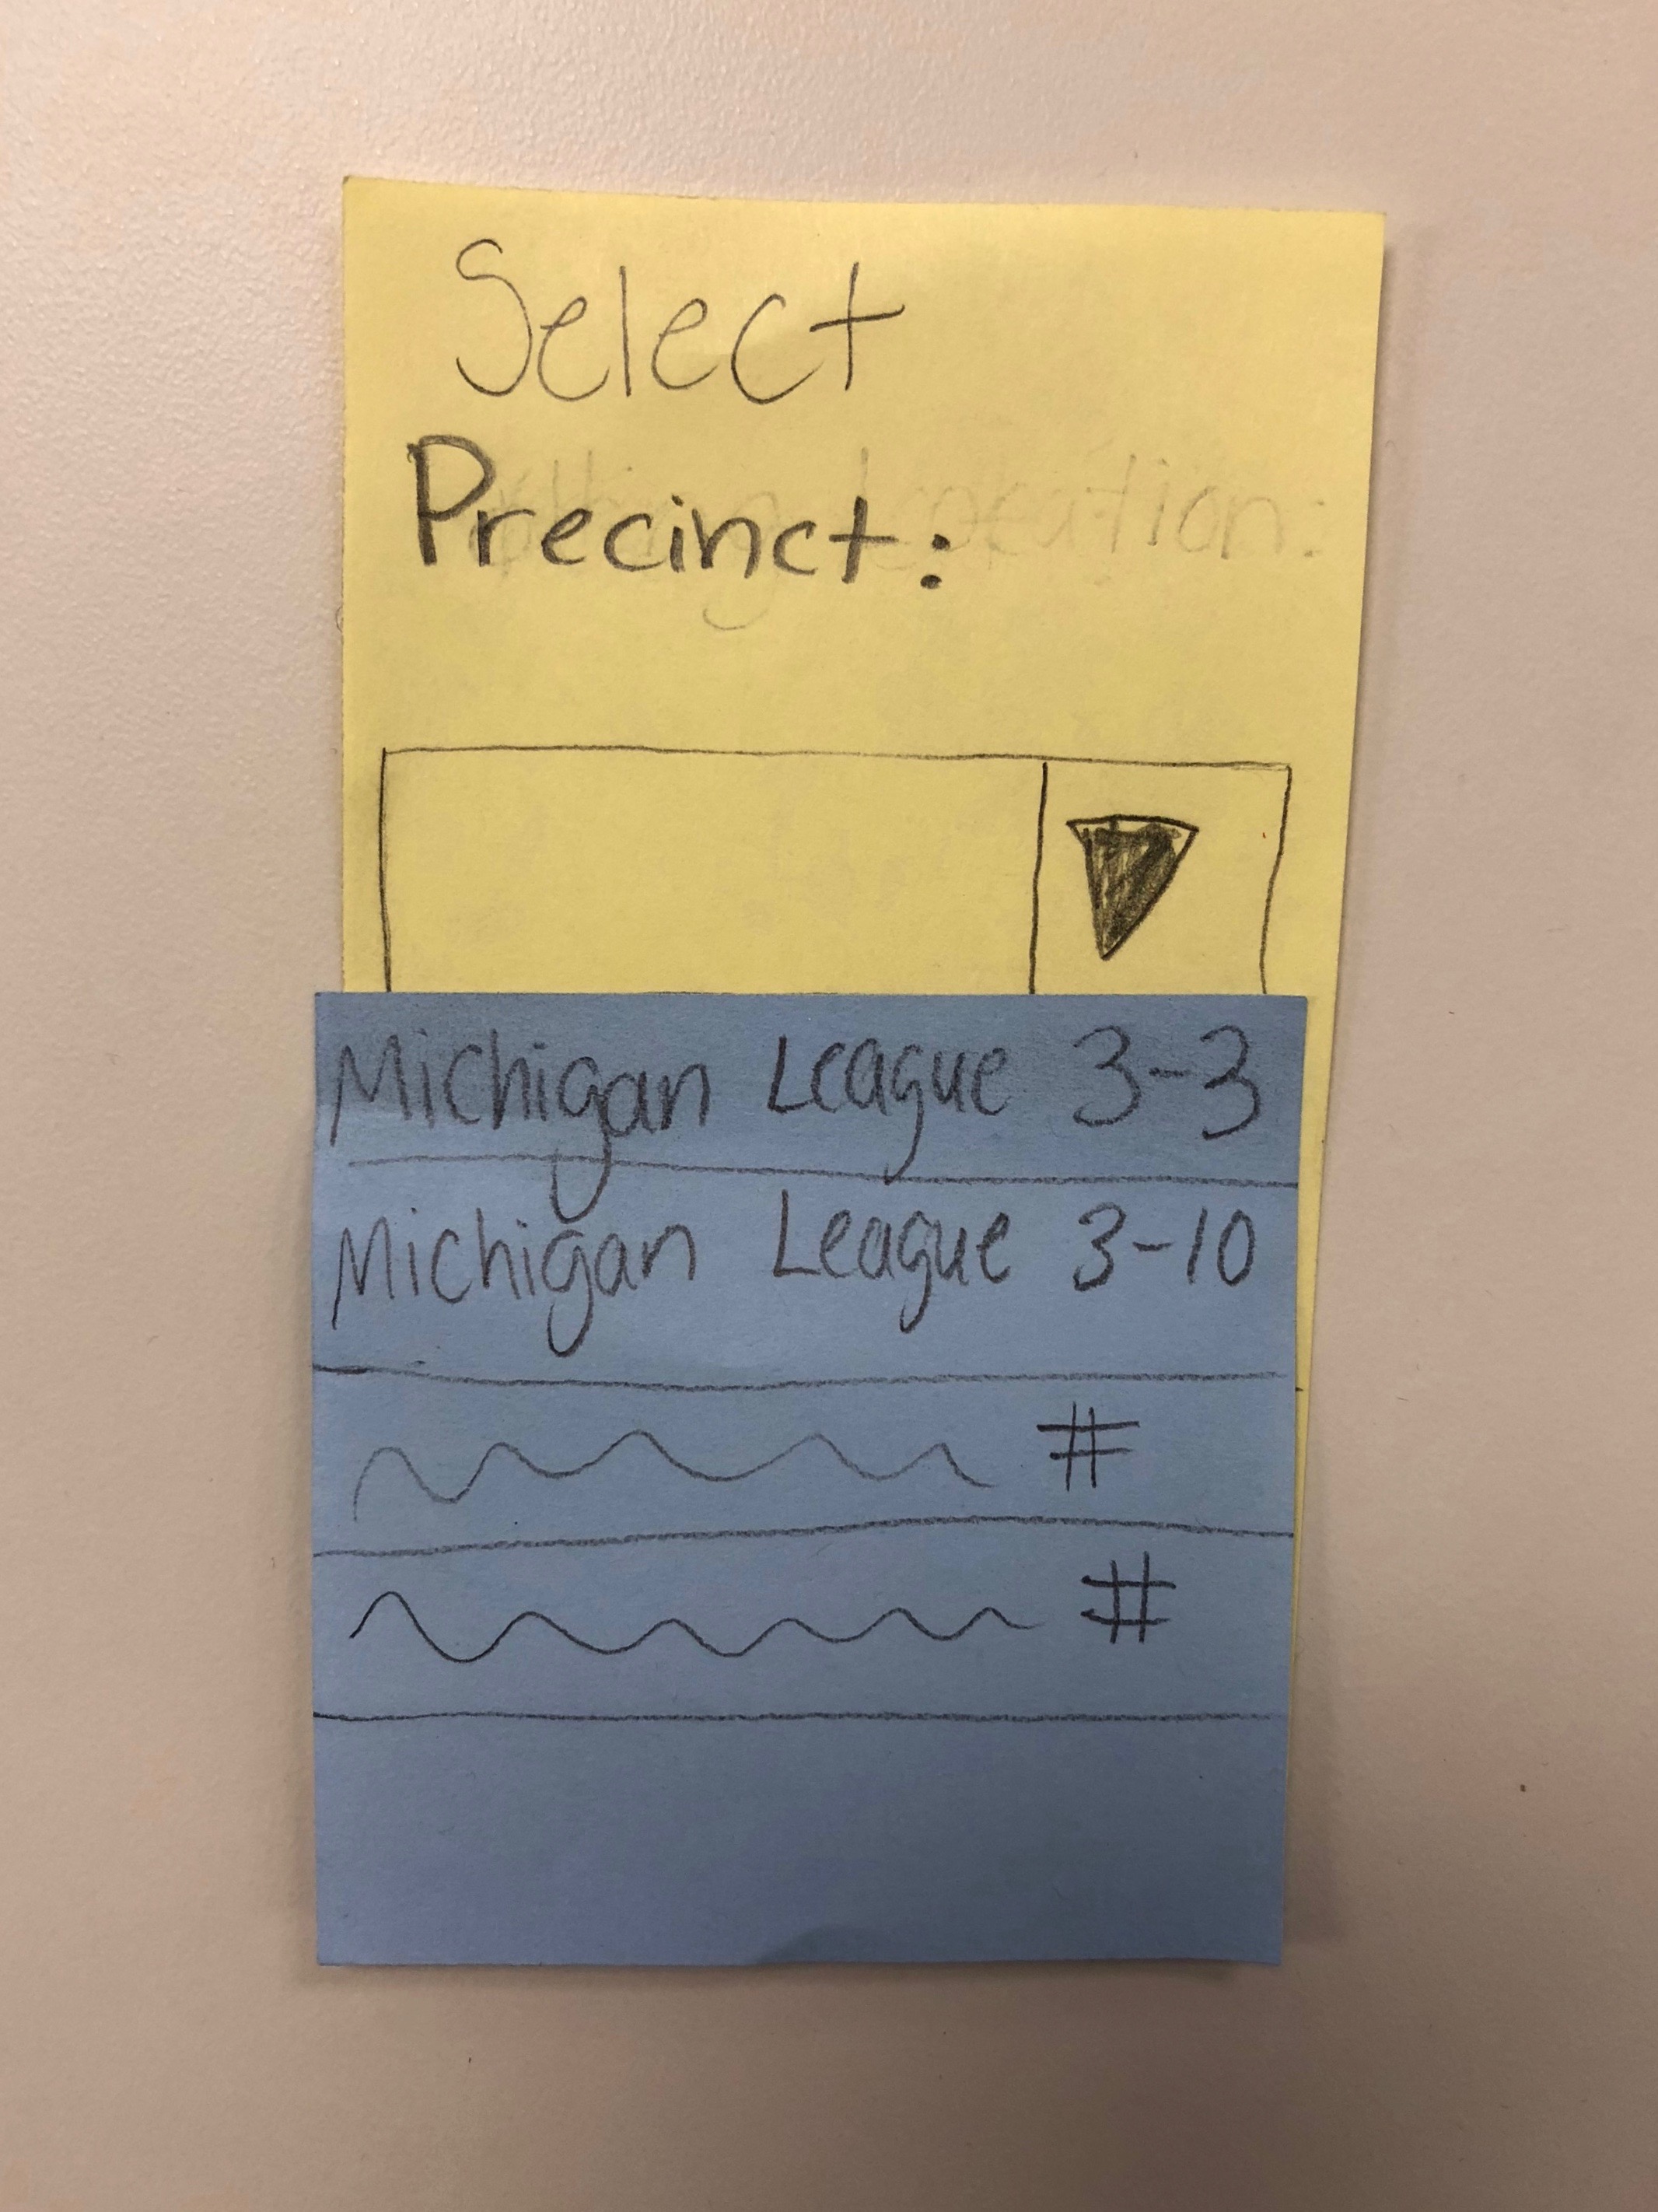
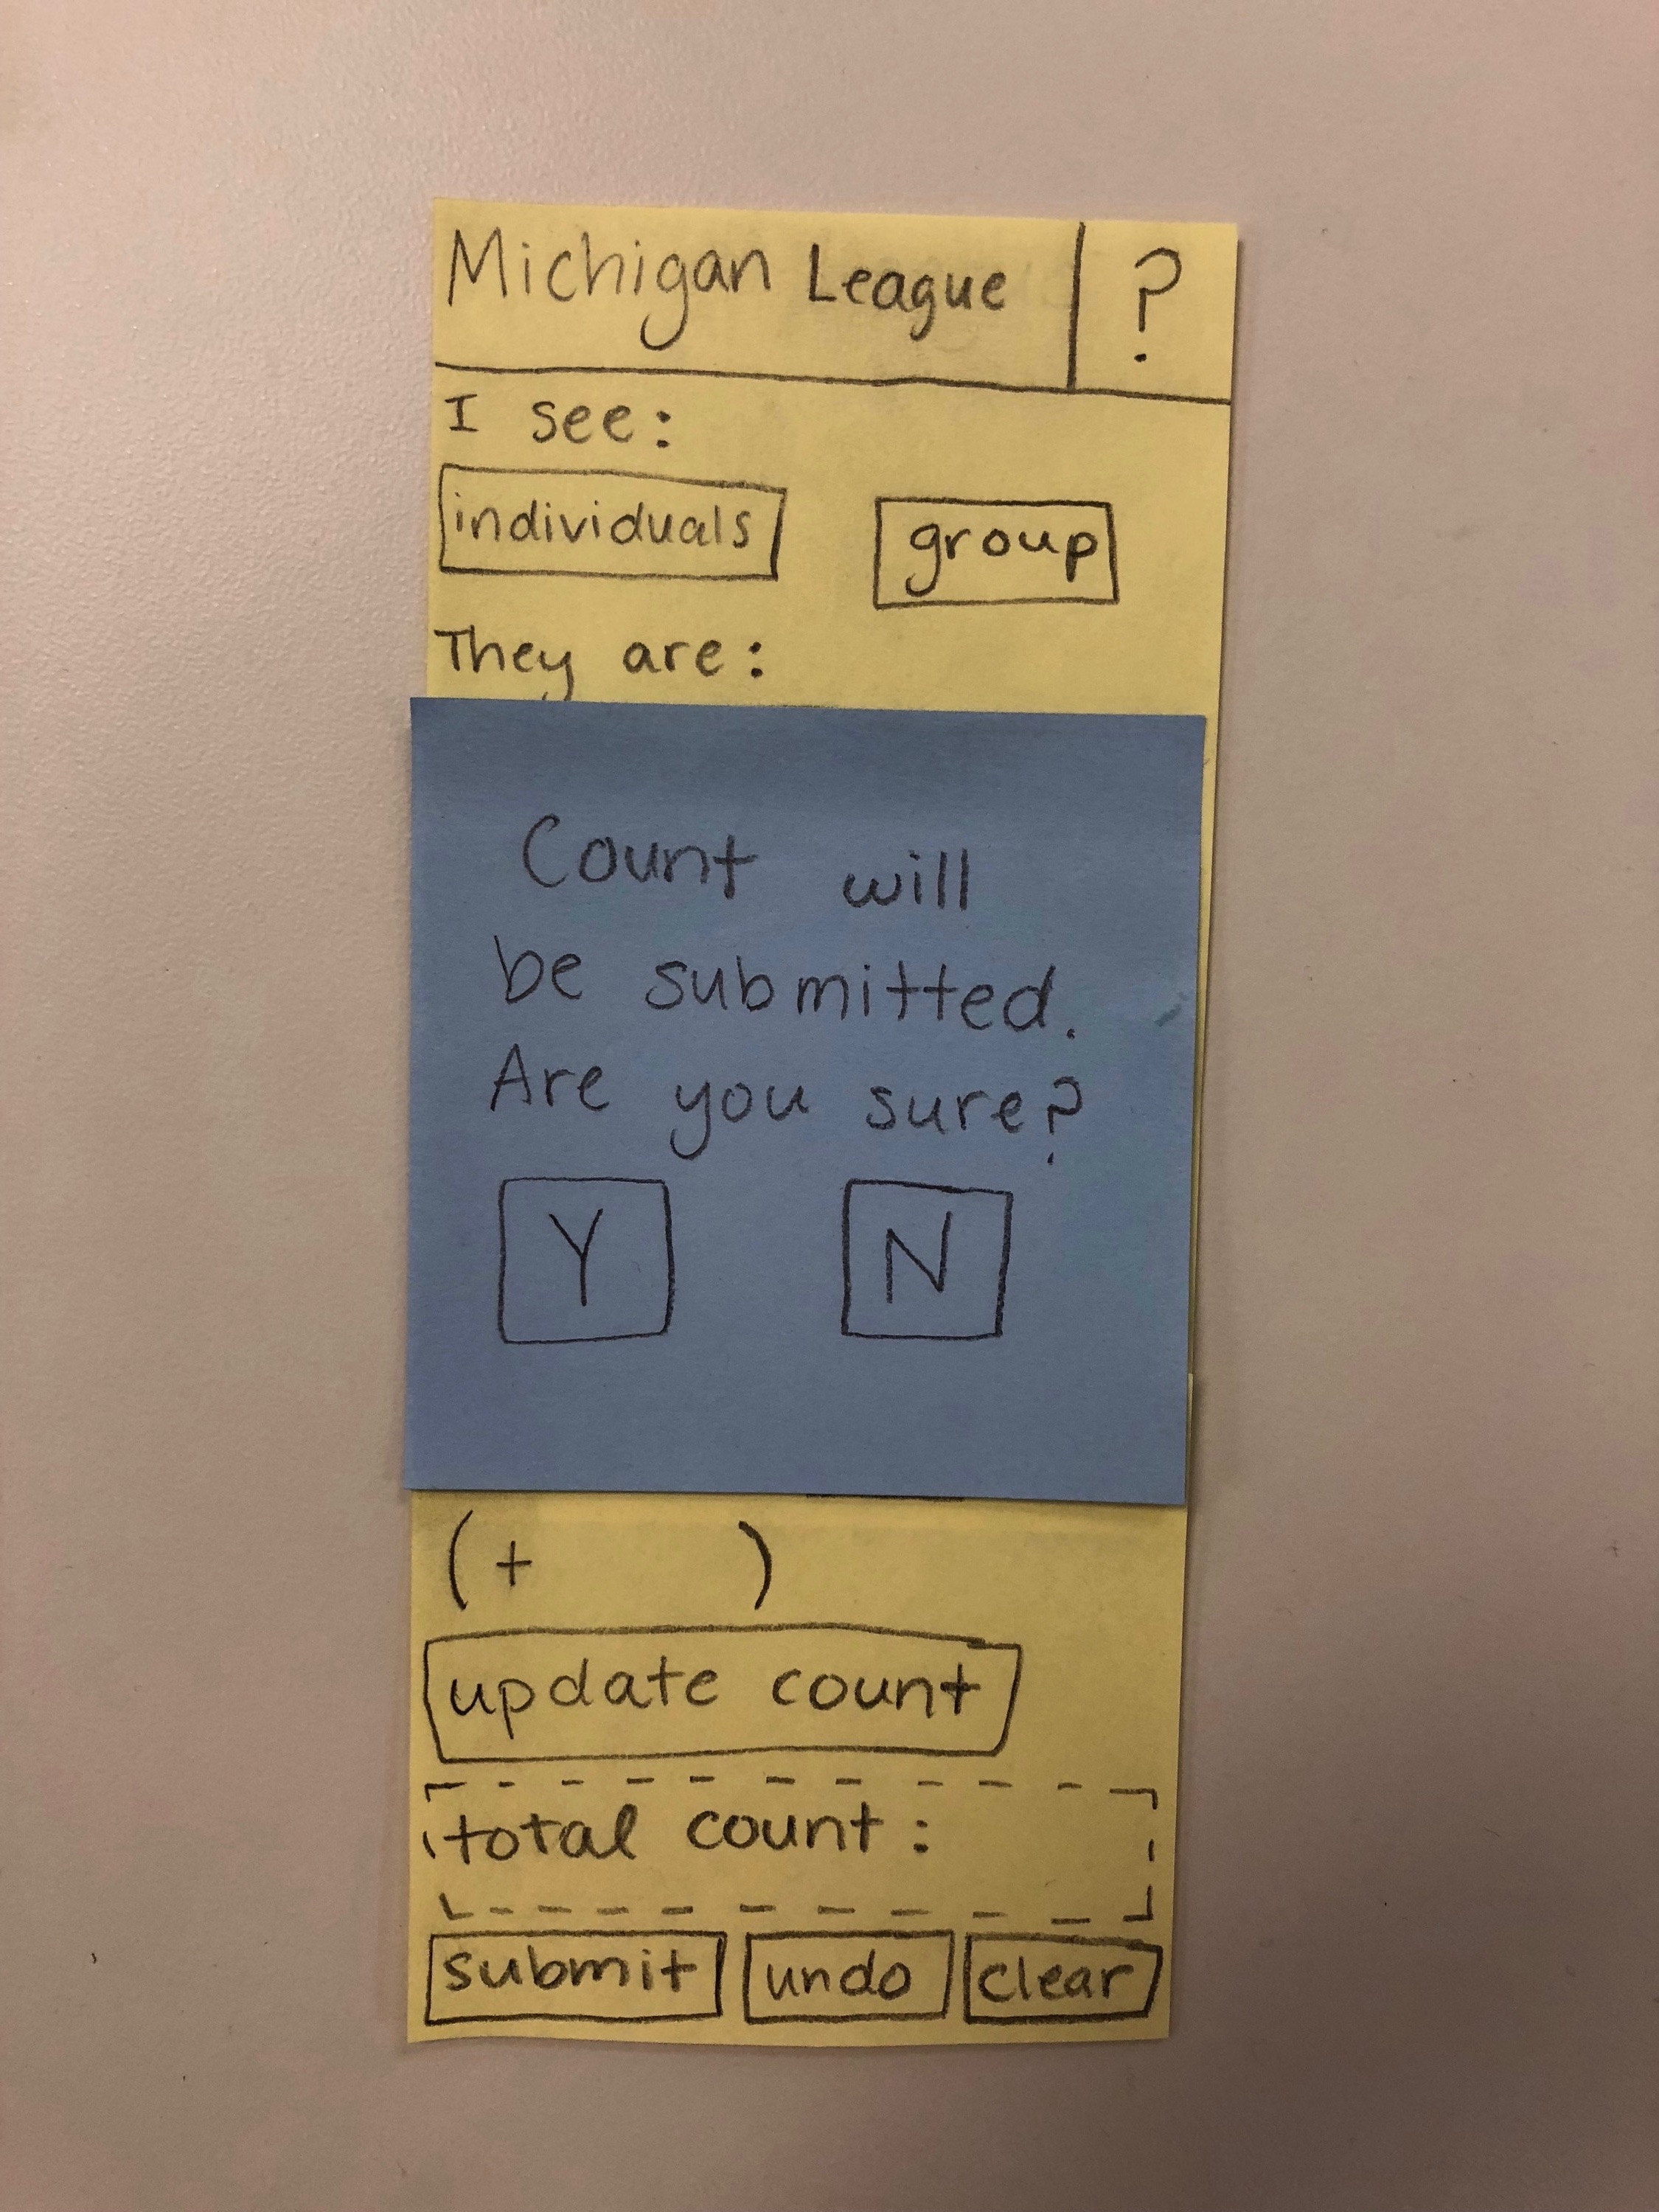
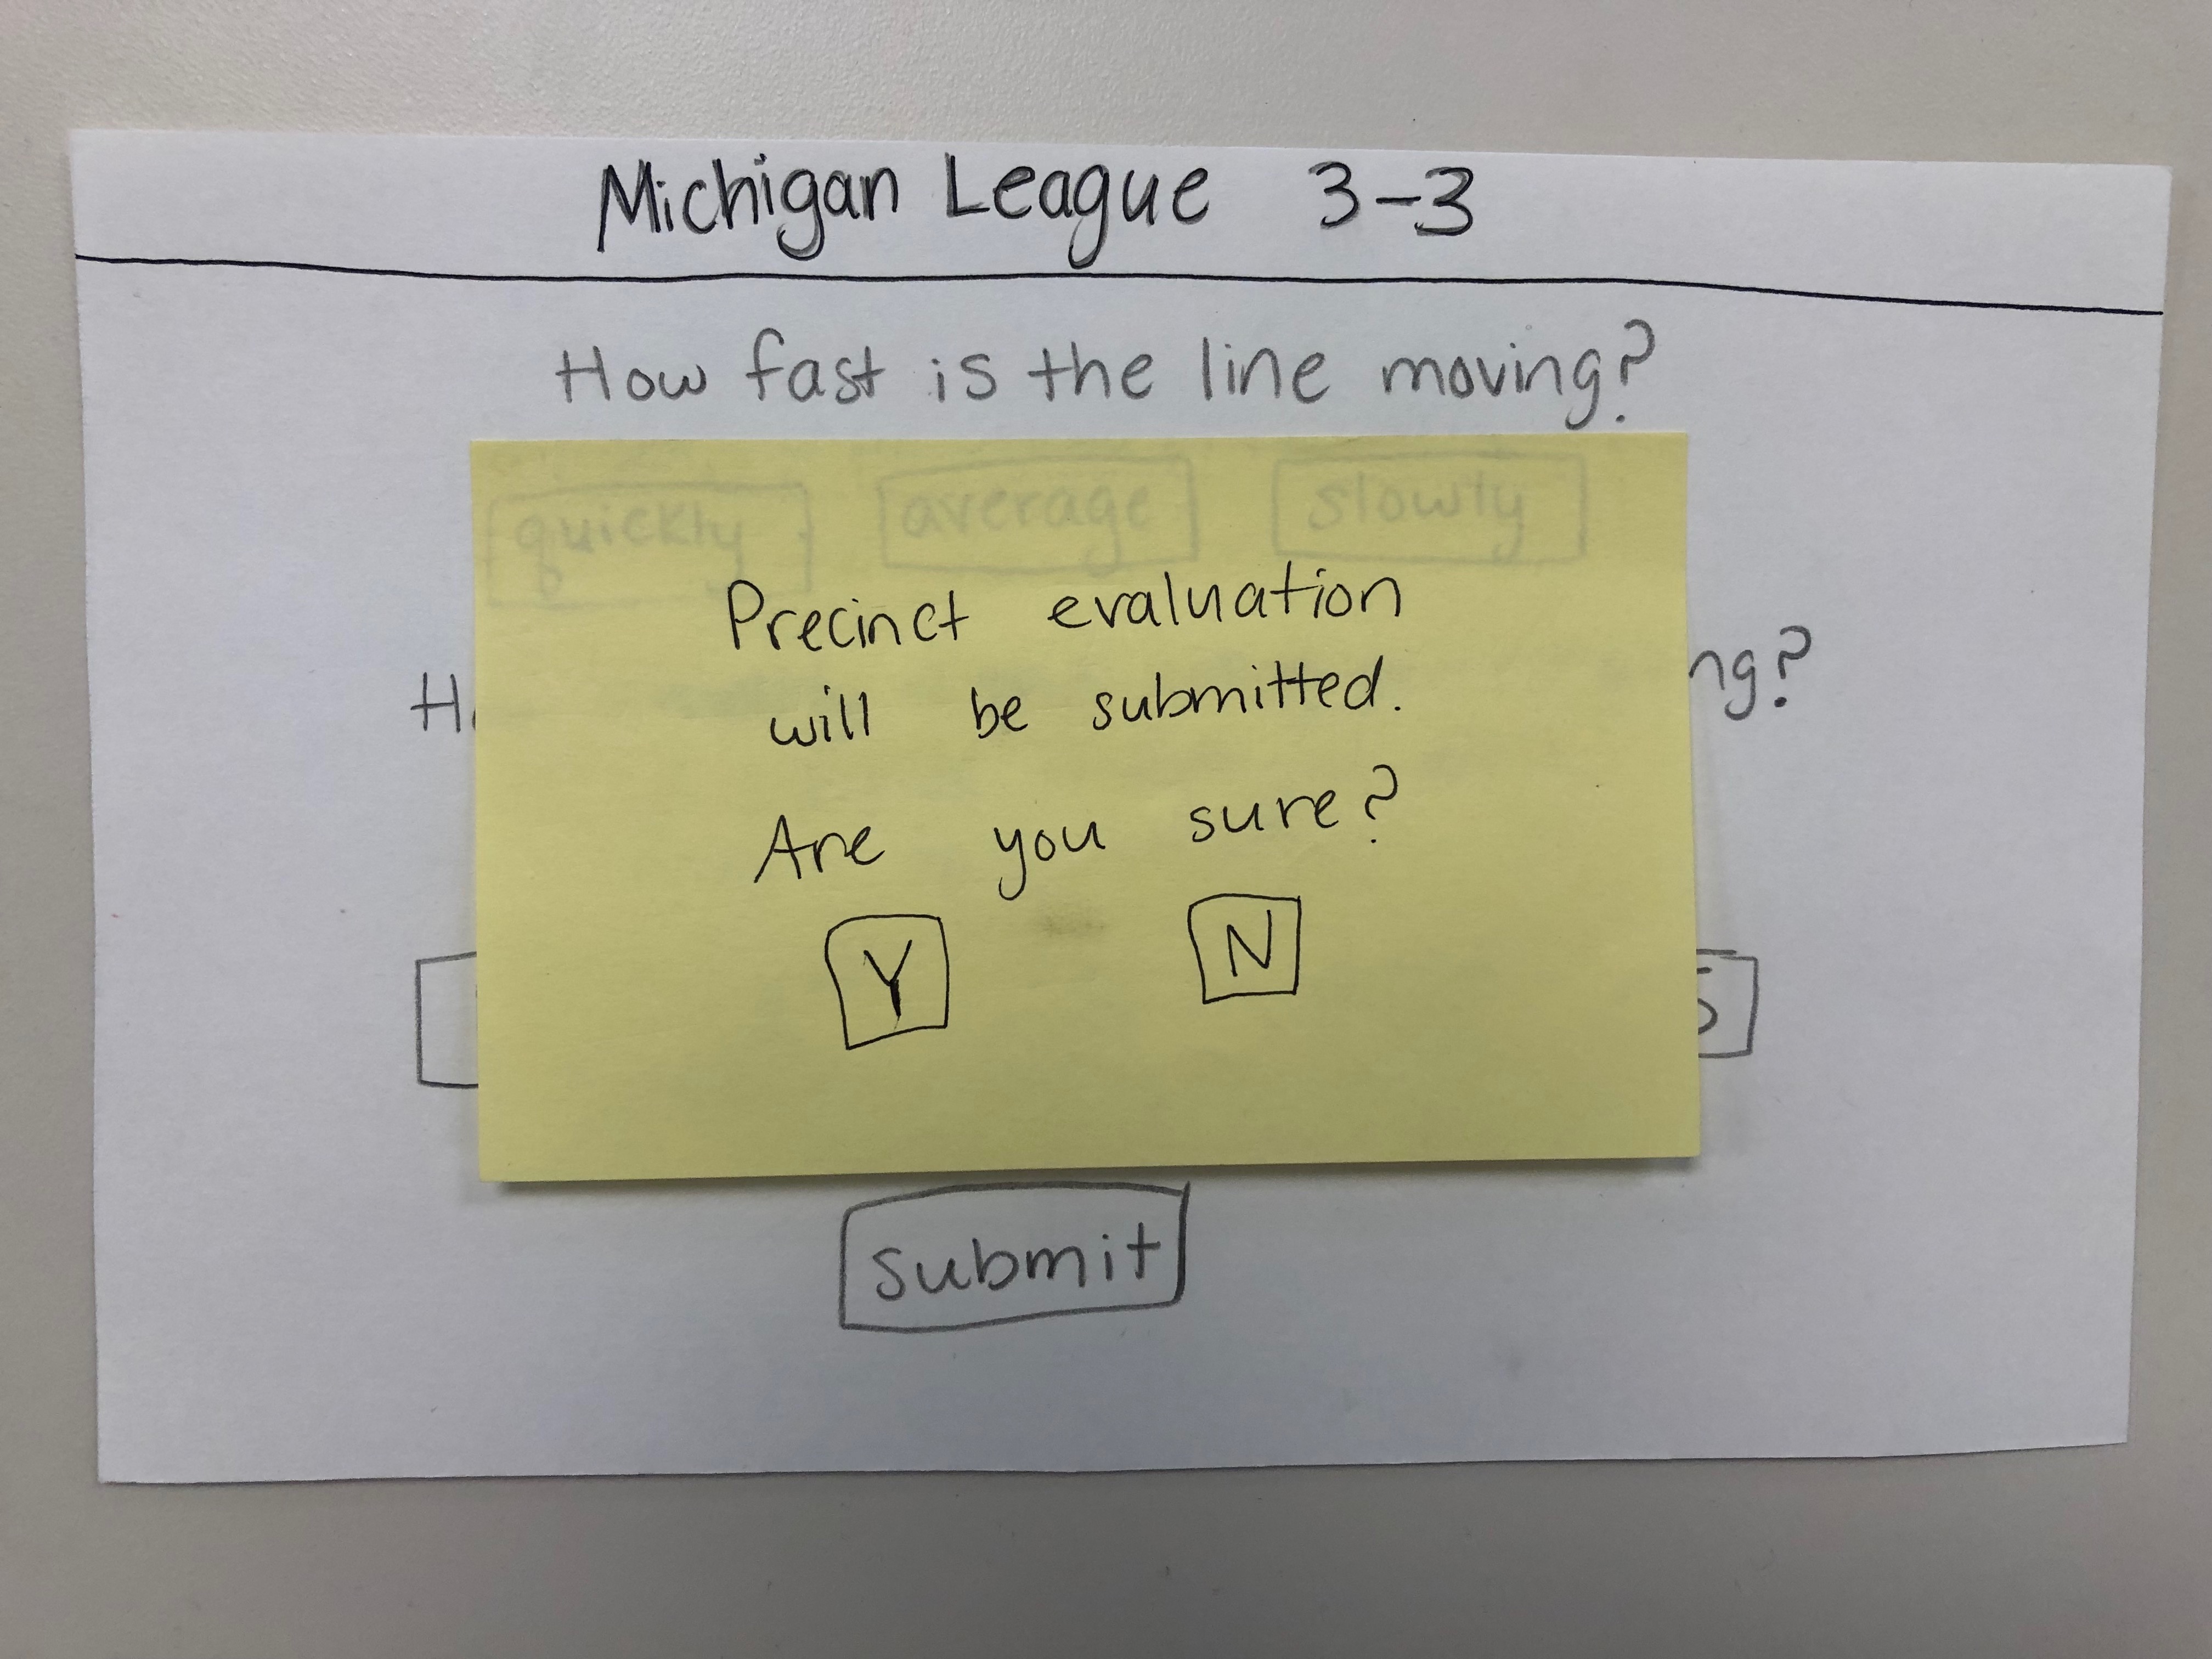
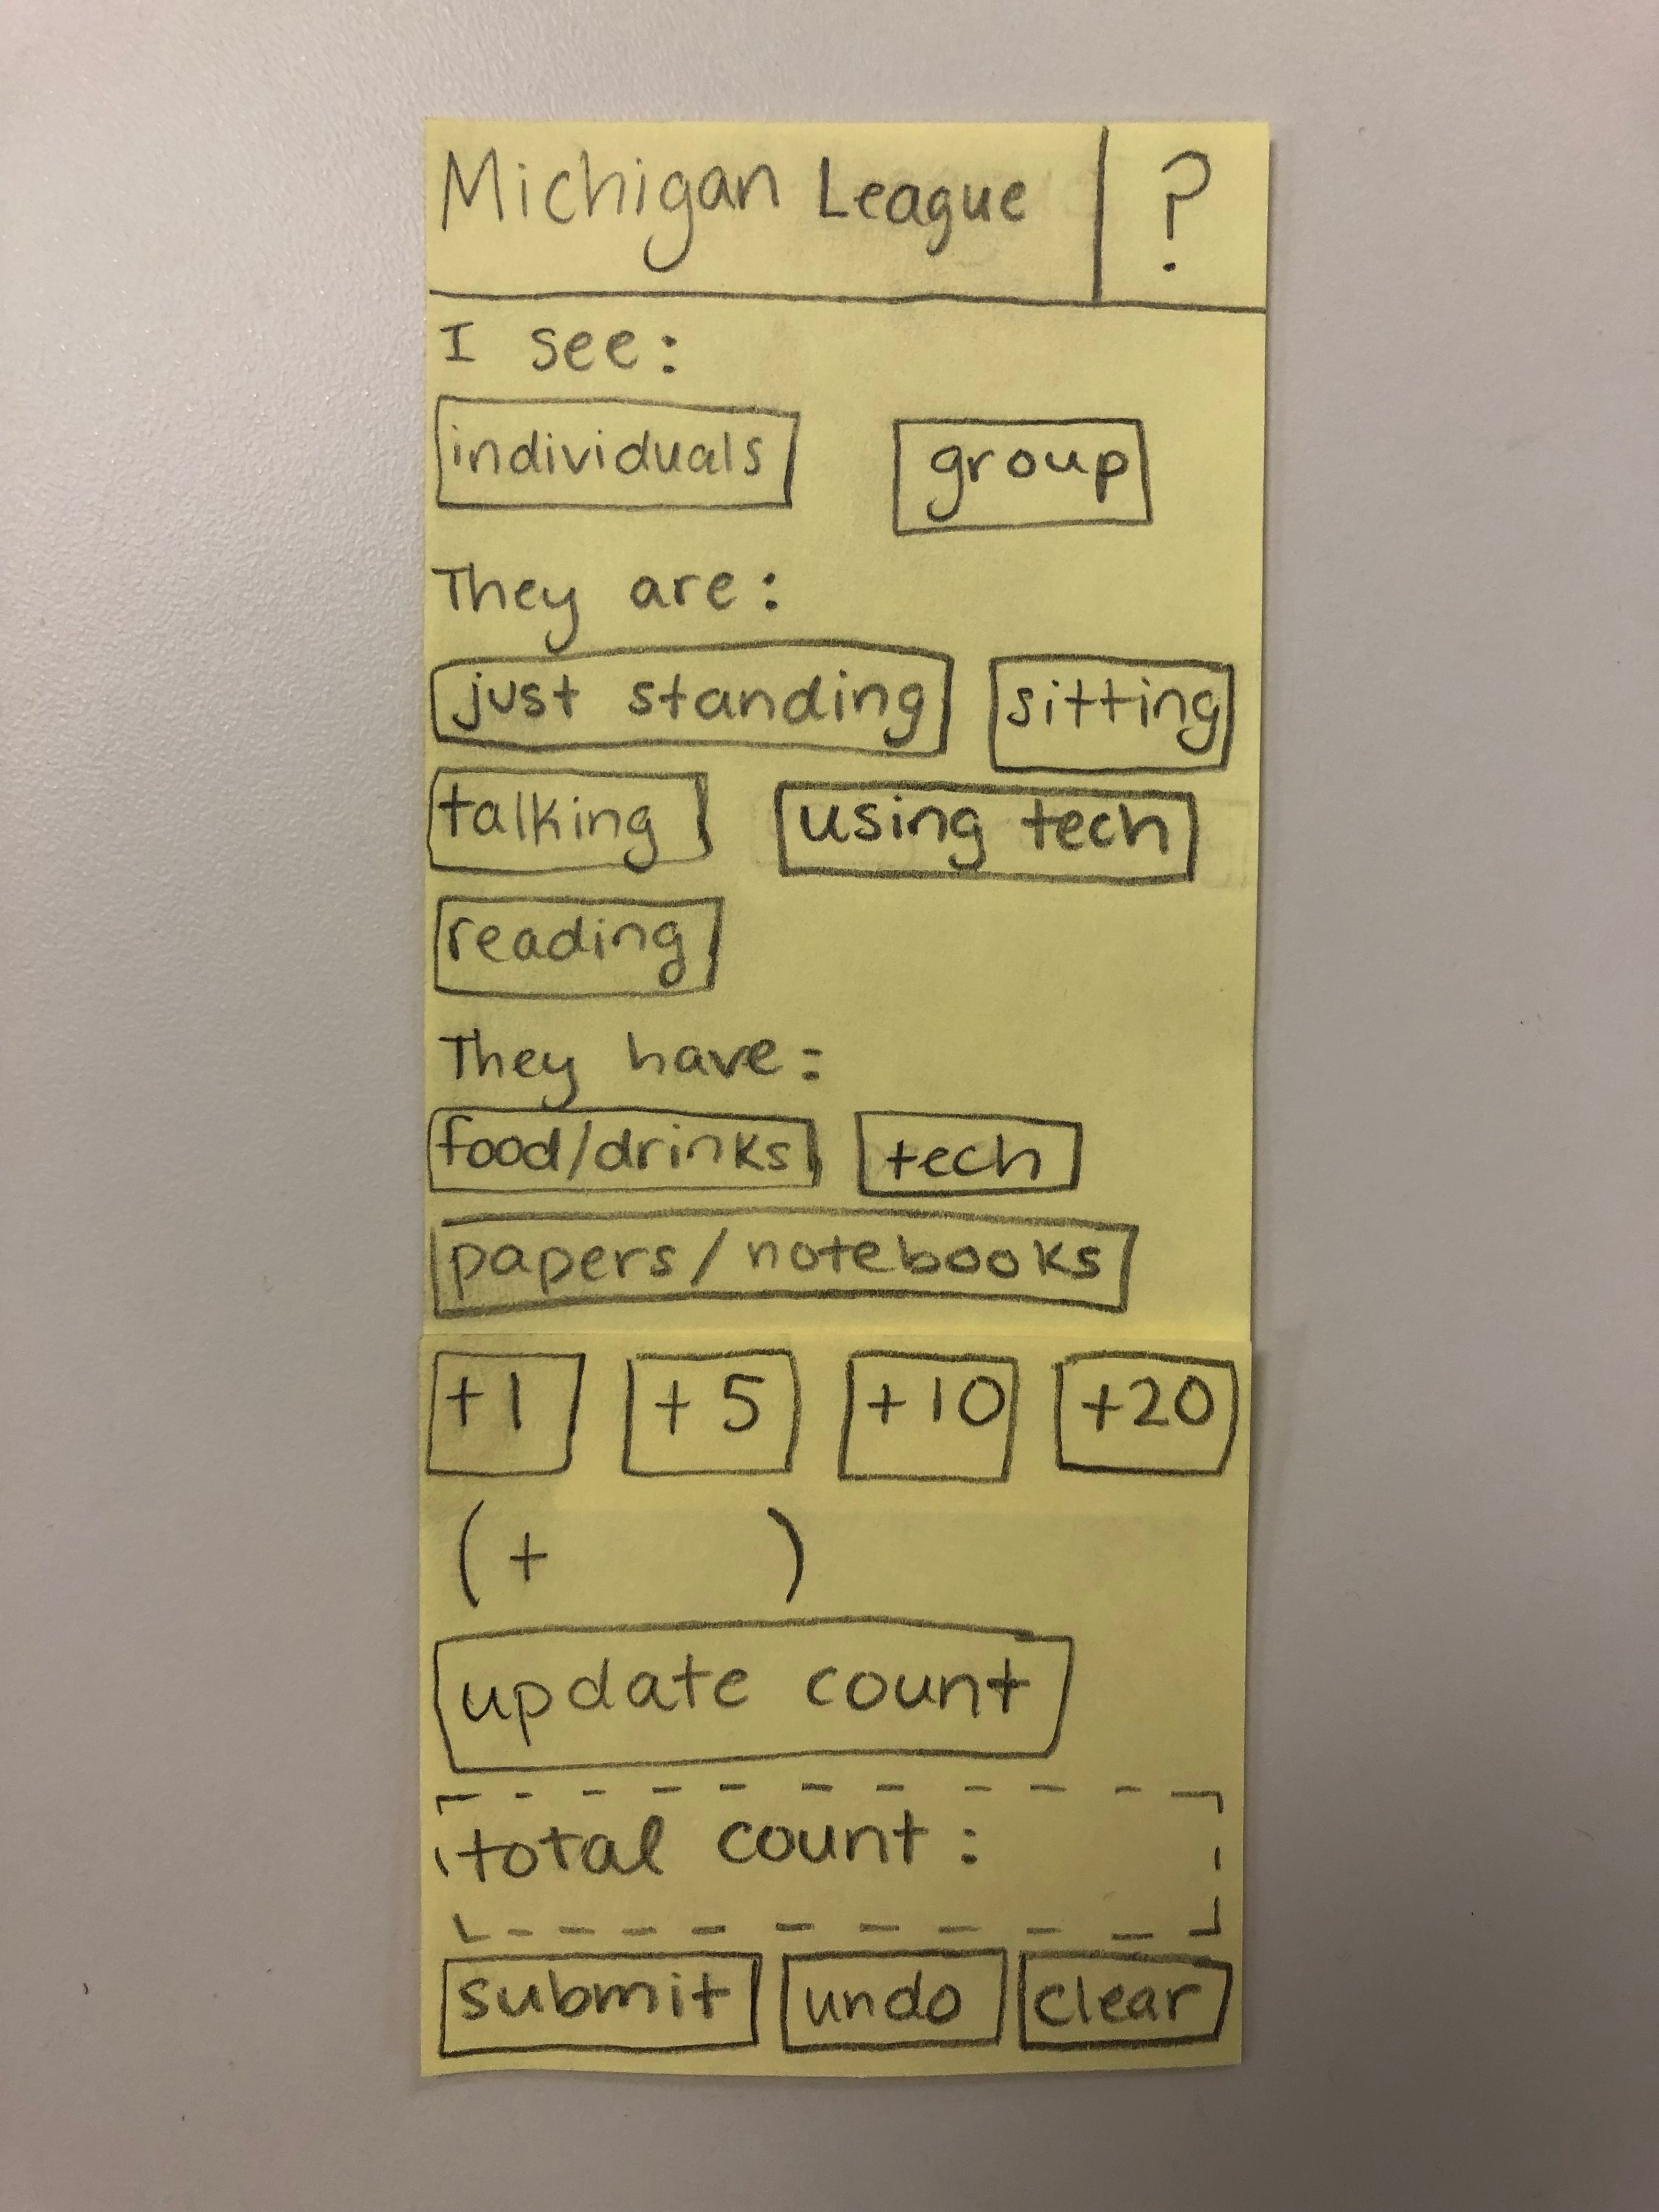
We designed a paper prototype of a website election workers could access via their phones or tablets already provided by the city and tested it with current poll-workers.
Digital Prototyping
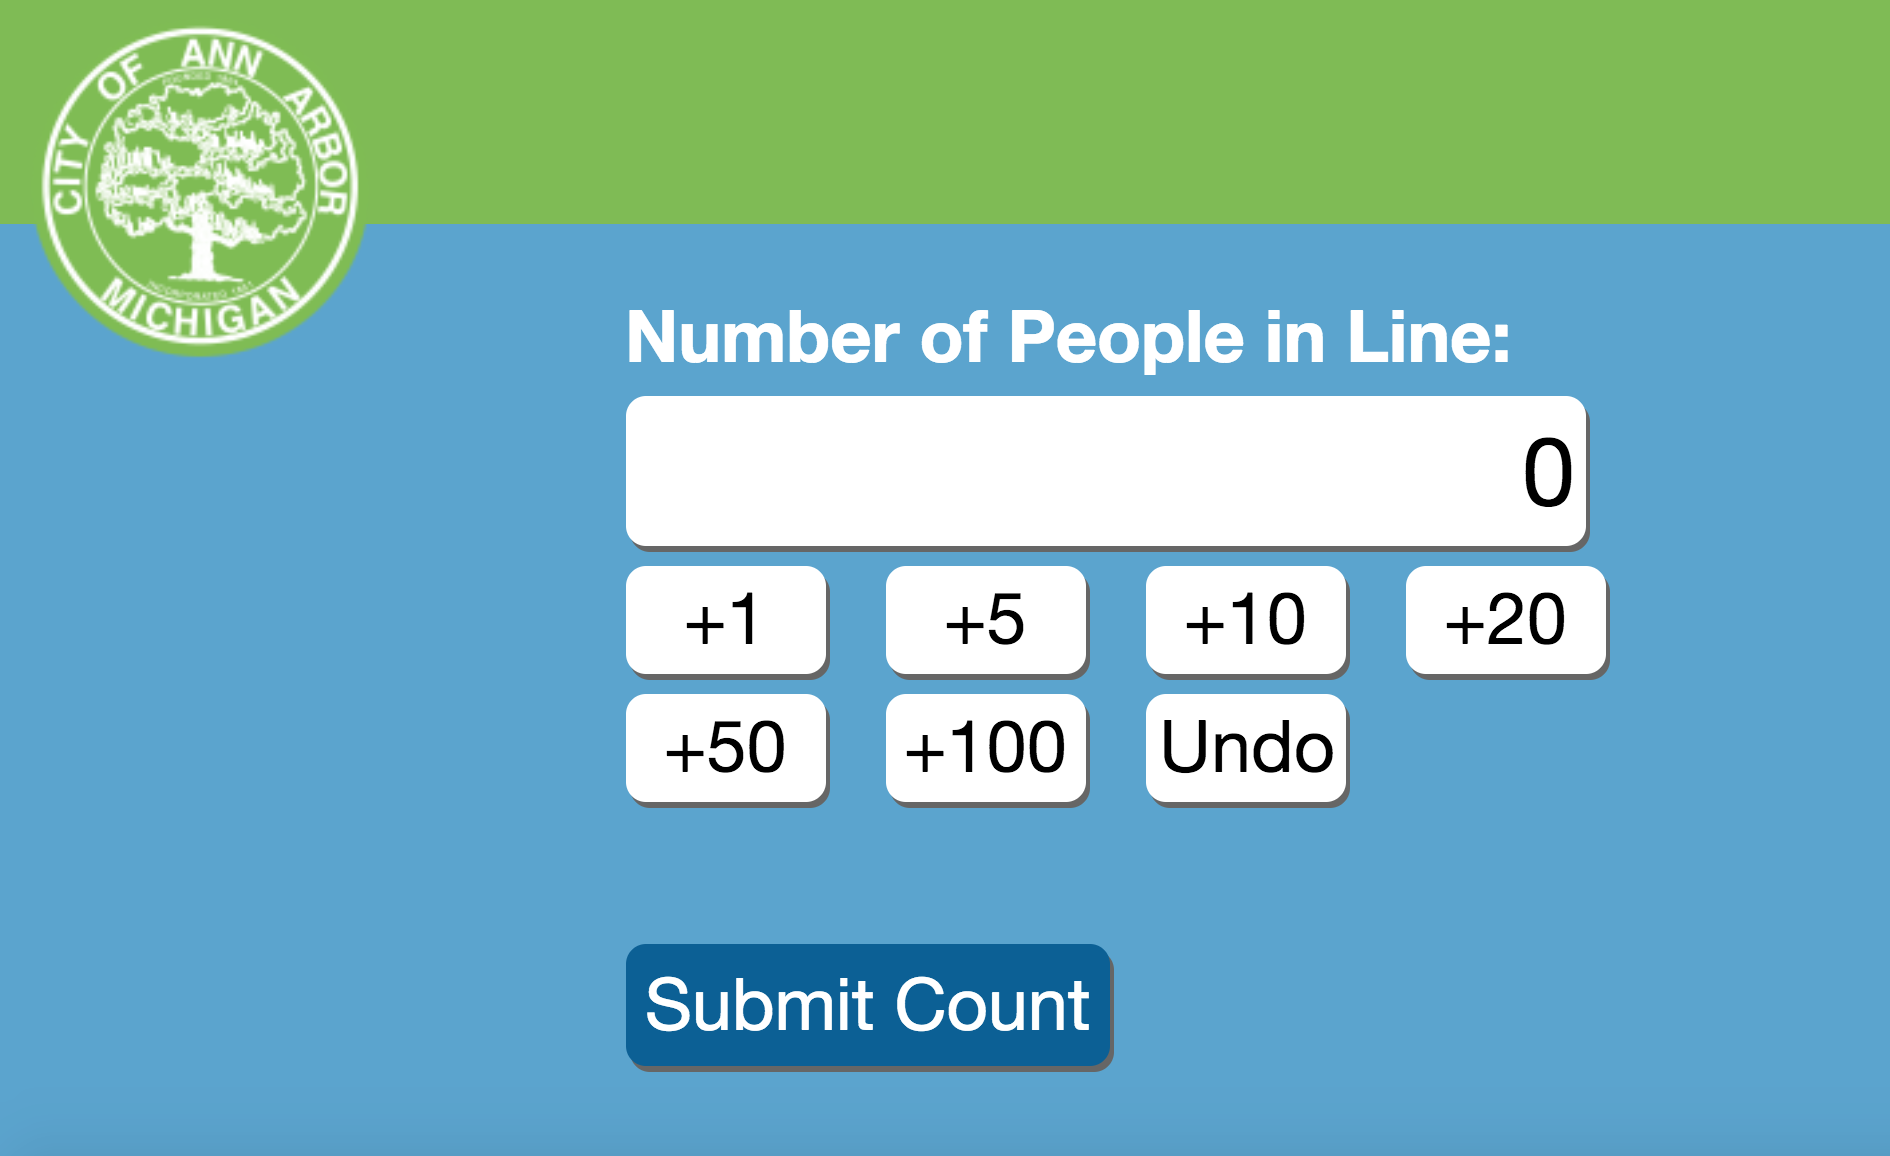
We then workshopped and tested a digital prototype (created in Sketch and Marvel) that we presented to the City Clerk. That prototype was used as a basis for a website that was tested in the 2018 August primary by City Hall. After additional testing and modifying, we envisioned that the website would be available via phone or tablet to all poll-workers during future elections.
Impact
The website was created and used in the November 2018 general election. Using the line counts throughout the day, staff were able to quickly identify a few isolated line problem locations and respond with resources. Staff within City Hall could also produce confident media reports regarding voter turnout and current lines throughout the City.
Next Steps
The University of Michigan School of Information recruited volunteers to walk several routes on campus on Election Day to submit line counts. 751 counts were received, an average of 14 per precinct for the 13-hour day, with the most consistent and frequent counts coming from the campus precincts with the volunteer counters. As more data is collected over the course of the next few years, it will be possible to analyze voting trends and tailor voter outreach and resource allocation to fit this new knowledge.
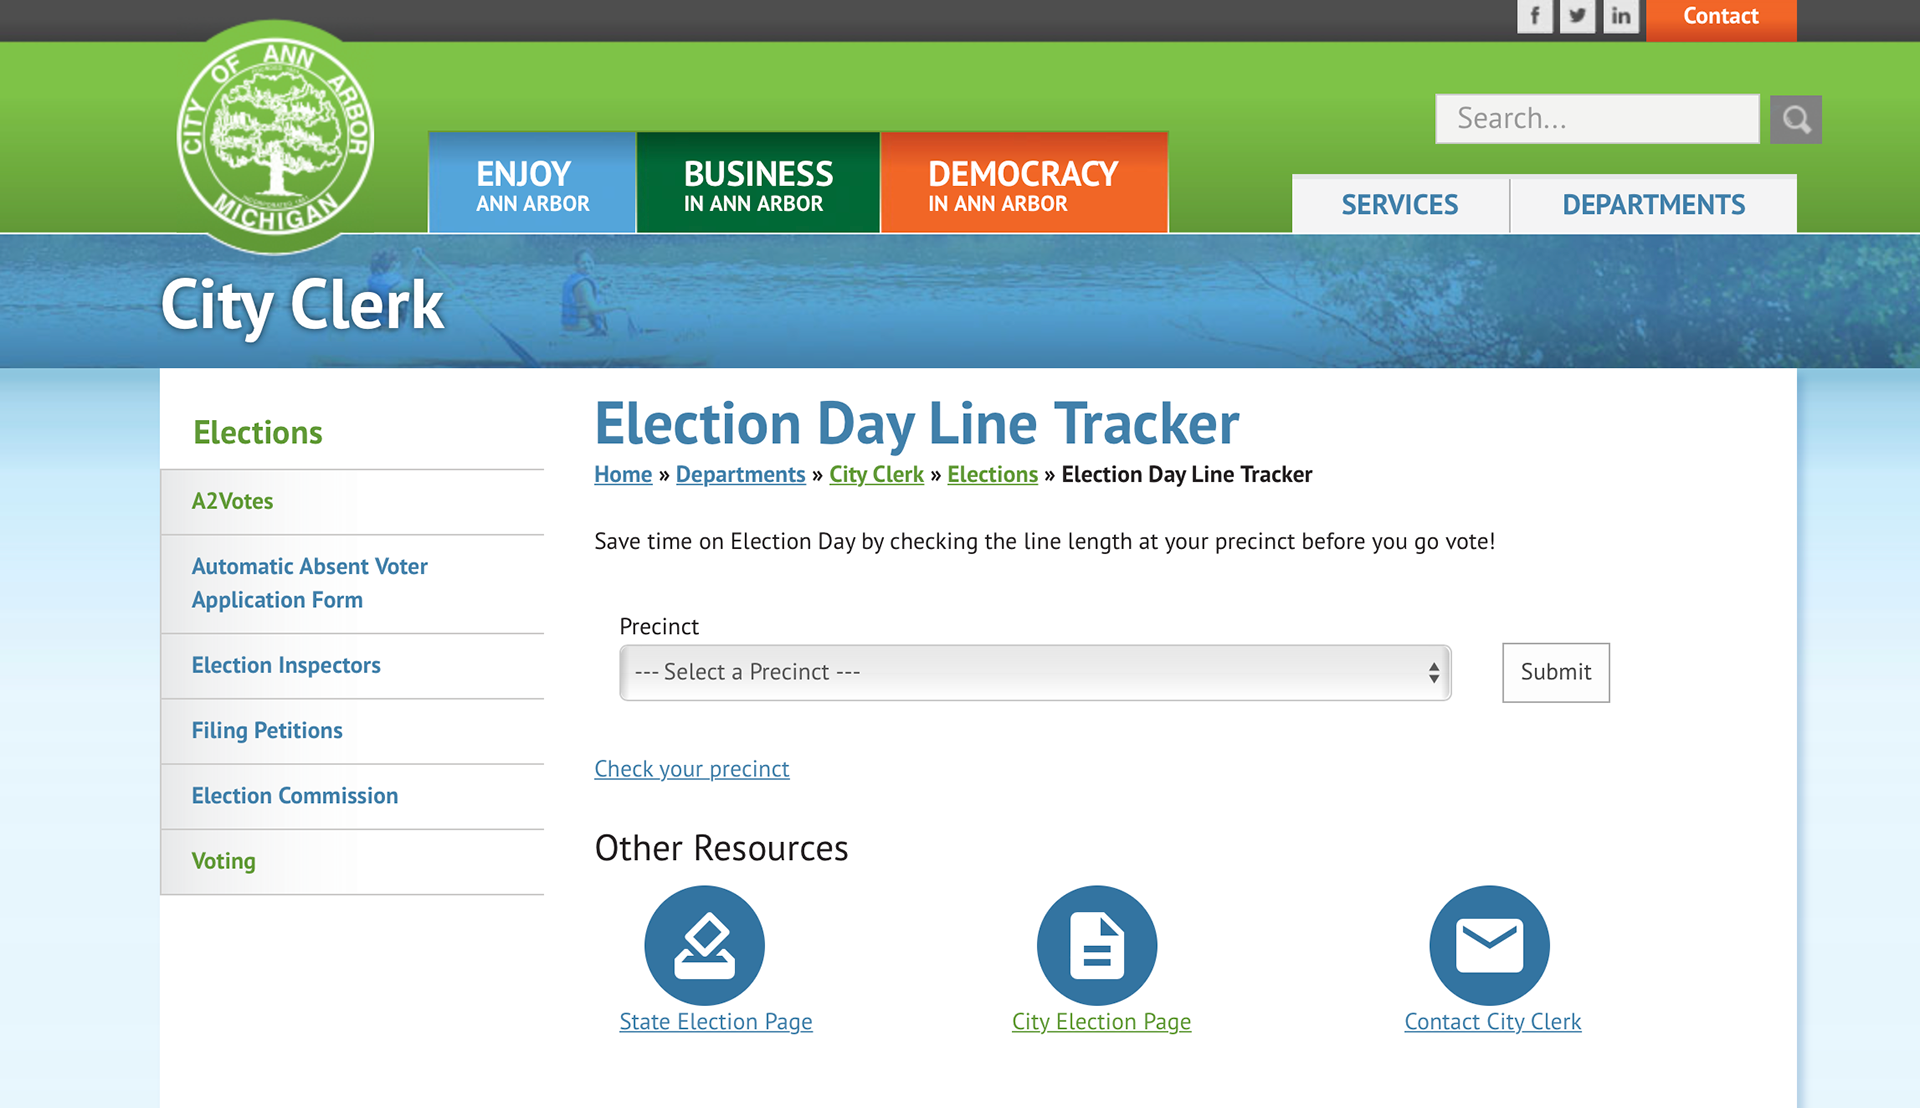
The CID program continued this project with School of Information students during the 2018-2019 school year. Now, the tool has developed into a public-facing information source, providing voters with real-time line lengths that they can access directly from the city's website.
